13.6.14. Macro “modelerTestKriging.C”
13.6.14.1. Objective
The idea is to provide a simple example of a kriging usage, and an how to, to produce plots in one dimension to represent the results. This example is the one taken from [Bla17] that uses a very simple set of six points as training database:
#TITLE: utf-1D-train.dat
#COLUMN_NAMES: x1|y

6.731290e-01 3.431918e-01
7.427596e-01 9.356860e-01
4.518467e-01 -3.499771e-01
2.215734e-02 2.400531e+00
9.915253e-01 2.412209e+00
1.815769e-01 1.589435e+00
The aim will be to get a kriging model that describes this dataset and to check its consistency over a certain number of points (here 100 points) which will be the testing database:
#TITLE: utf-1D-test.dat
#COLUMN_NAMES: x1|y

5.469435e-02 2.331524e+00
3.803054e-01 -3.277316e-02
7.047152e-01 6.030177e-01
2.360045e-02 2.398694e+00
9.271965e-01 2.268814e+00
7.868263e-01 1.324318e+00
7.791920e-01 1.257942e+00
6.107965e-01 -8.514510e-02
1.362316e-01 1.926999e+00
5.709913e-01 -2.758435e-01
8.738804e-01 1.992941e+00
2.251602e-01 1.219826e+00
9.175259e-01 2.228545e+00
5.128368e-01 -4.096161e-01
7.692913e-01 1.170999e+00
7.394406e-01 9.062407e-01
5.364506e-01 -3.772856e-01
1.861864e-01 1.551961e+00
7.573444e-01 1.065237e+00
1.005755e-01 2.141109e+00
9.114685e-01 2.201001e+00
3.628465e-01 7.920271e-02
2.383583e-01 1.103353e+00
7.468092e-01 9.716492e-01
3.126209e-01 4.578112e-01
8.034716e-01 1.466248e+00
6.730402e-01 3.424931e-01
8.021345e-01 1.455015e+00
2.503736e-01 9.966807e-01
9.001793e-01 2.145059e+00
7.019990e-01 5.799112e-01
6.001746e-01 -1.432102e-01
4.925013e-01 -4.126441e-01
5.685795e-01 -2.849419e-01
1.238257e-01 2.007351e+00
2.825838e-01 7.124861e-01
4.025708e-01 -1.574002e-01
8.562999e-01 1.875879e+00
3.214125e-01 3.865241e-01
2.021767e-01 1.418581e+00
6.338581e-01 5.717657e-02
3.042007e-01 5.276410e-01
4.860707e-01 -4.088007e-01
9.645326e-01 2.379243e+00
3.583711e-02 2.378513e+00
2.143110e-01 1.314473e+00
7.299624e-01 8.224203e-01
2.719263e-02 2.393622e+00
3.321495e-01 3.020224e-01
8.642671e-01 1.930341e+00
8.893604e-01 2.086039e+00
1.119469e-01 2.078562e+00
9.859741e-01 2.408725e+00
5.594688e-01 -3.166326e-01
1.904448e-01 1.516930e+00
4.232618e-01 -2.529865e-01
1.402221e-01 1.899932e+00
2.647519e-01 8.691058e-01
1.667035e-01 1.706823e+00
2.332246e-01 1.148786e+00
8.324190e-01 1.700059e+00
4.743443e-01 -3.958790e-01
3.435927e-01 2.154677e-01
9.846049e-01 2.407603e+00
9.705327e-01 2.390043e+00
6.631883e-01 2.662970e-01
6.153726e-01 -5.862472e-02
4.632361e-01 -3.766509e-01
6.474053e-01 1.502050e-01
7.161034e-02 2.273461e+00
4.514511e-01 -3.489255e-01
5.976782e-02 2.315661e+00
8.361934e-01 1.729000e+00
5.280981e-01 -3.922313e-01
9.394759e-01 2.313181e+00
2.710088e-01 8.138628e-01
8.161943e-01 1.571375e+00
5.047683e-01 -4.135789e-01
8.427635e-02 2.220534e+00
3.540224e-01 1.400987e-01
4.698548e-03 2.413597e+00
9.124315e-02 2.188105e+00
9.996285e-01 2.414210e+00
4.167139e-01 -2.249546e-01
5.892062e-01 -1.978247e-01
2.929336e-01 6.231119e-01
4.456454e-01 -3.325379e-01
1.148699e-02 2.410532e+00
3.892636e-01 -8.548741e-02
7.188374e-01 7.248622e-01
3.697949e-01 3.323350e-02
6.864519e-01 4.502113e-01
1.586679e-01 1.767741e+00
6.603030e-01 2.445009e-01
6.277168e-01 1.721489e-02
4.305704e-01 -2.817686e-01
1.553435e-01 1.792379e+00
5.476842e-01 -3.512131e-01
8.475444e-01 1.813503e+00
9.527370e-01 2.352313e+00
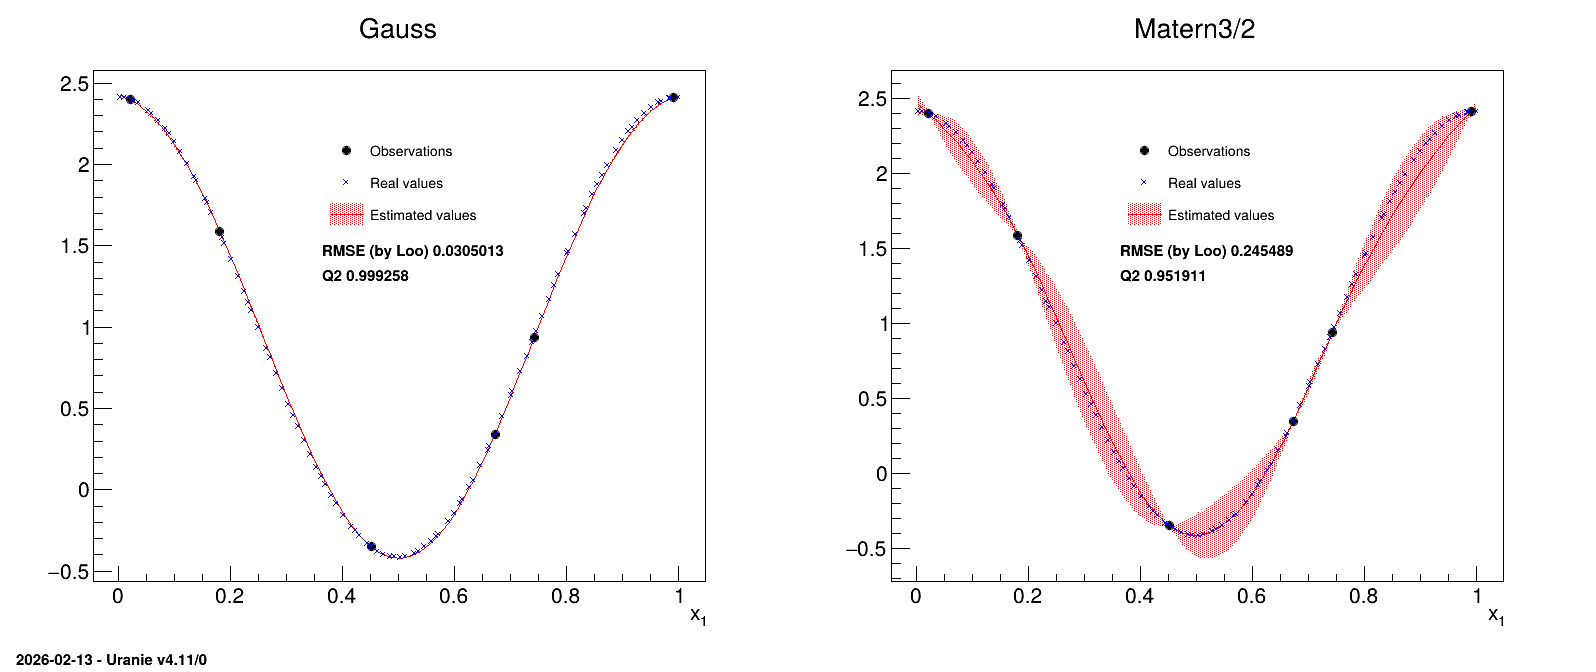
In this example, two different correlation functions are tested and the obtained results are compared at the end.
13.6.14.2. Macro Uranie
void PrintSolutions(TDataServer *tdsObs, TDataServer *tdsEstim, string title)
{
    const int nbObs = tdsObs->getNPatterns();
    const int nbEst = tdsEstim->getNPatterns();
    vector<double> Rxarr(nbEst,0), x_arr(nbEst,0), y_est(nbEst,0), y_rea(nbEst,0), std_var(nbEst,0);

    tdsEstim->computeRank("x1");
    tdsEstim->getTuple()->copyBranchData(&Rxarr[0],nbEst,"Rk_x1");
    tdsEstim->getTuple()->copyBranchData(&x_arr[0],nbEst,"x1");
    tdsEstim->getTuple()->copyBranchData(&y_est[0],nbEst,"yEstim");
    tdsEstim->getTuple()->copyBranchData(&y_rea[0],nbEst,"y");
    tdsEstim->getTuple()->copyBranchData(&std_var[0],nbEst,"vEstim");

    vector<double> xarr(nbEst,0), yest(nbEst,0), yrea(nbEst,0), stdvar(nbEst,0);
    int ind;
    for (int i=0; i<nbEst; i++)
    {
        ind = int(Rxarr[i]) - 1;
        xarr[ind] = x_arr[i];
        yest[ind] = y_est[i];
        yrea[ind] = y_rea[i];
        stdvar[ind] = 2*sqrt(fabs(std_var[i]));
    }

    vector<double> xobs(nbObs,0); tdsObs->getTuple()->copyBranchData(&xobs[0],nbObs,"x1");
    vector<double> yobs(nbObs,0); tdsObs->getTuple()->copyBranchData(&yobs[0],nbObs,"y");

    TGraph *gobs = new TGraph(nbObs,&xobs[0],&yobs[0]);
    gobs->SetMarkerColor(1); gobs->SetMarkerSize(1); gobs->SetMarkerStyle(8);
    TGraphErrors *gest = new TGraphErrors(nbEst,&xarr[0],&yest[0],0,&stdvar[0]);
    gest->SetLineColor(2); gest->SetLineWidth(1); gest->SetFillColor(2); gest->SetFillStyle(3002);
    TGraph *grea = new TGraph(nbEst,&xarr[0],&yrea[0]);
    grea->SetMarkerColor(4); grea->SetMarkerSize(1); grea->SetMarkerStyle(5); grea->SetTitle("Real Values");

    TMultiGraph *mg = new TMultiGraph("toto", title.c_str());
    mg->Add(gest,"l3"); mg->Add(gobs,"P"); mg->Add(grea,"P");
    mg->Draw("A");
    mg->GetXaxis()->SetTitle("x_{1}");

    TLegend *leg= new TLegend(0.4,0.65,0.65,0.8);
    leg->AddEntry(gobs, "Observations", "p");
    leg->AddEntry(grea, "Real values", "p");
    leg->AddEntry(gest, "Estimated values", "lf");
    leg->Draw();
}


void modelerTestKriging(const string& figure="figure.png", const string& style="")
{
    //Create dataserver and read training database
    TDataServer *tdsObs = new TDataServer("tdsObs","observations");
    tdsObs->fileDataRead("utf-1D-train.dat");
    const int nbObs = 6;

    // Canvas, divided in 2
    TCanvas *Can = new TCanvas("can","can",10,32,1600,700);
    TPad *apad = new TPad("apad","apad",0, 0.03, 1, 1);
    apad->Draw();
    apad->Divide(2,1);

    //Name of the plot and correlation functions used
    string outplot="GaussAndMatern_1D_AllPoints.png";
    string Correl[2] = {"Gauss","Matern3/2"};

    //Pointer to needed objects, created in the loop
    TGPBuilder *gpb[2];
    TKriging *kg[2];
    TDataServer *tdsEstim[2];
    TLauncher2 *lkrig[2];

    stringstream sstr;
    //Looping over the two correlation function chosen
    for (int imet=0; imet<2; imet++)
    {
        //Create the TGPBuiler object with chosen option and find optimal parameters
        gpb[imet] = new TGPBuilder(tdsObs, "x1", "y", Correl[imet].c_str(), "");
        gpb[imet]->findOptimalParameters("LOO", 100, "Subplexe", 1000);

        //Get the kriging object
        kg[imet] = gpb[imet]->buildGP();

        //open the dataserver and read the testing basis
        sstr.str(""); sstr << "tdsEstim_" << imet;
        tdsEstim[imet] = new TDataServer(sstr.str().c_str(),"base de test");
        tdsEstim[imet]->fileDataRead("utf-1D-test.dat");

        //applied resulting kriging on test basis
        lkrig[imet] = new TLauncher2(tdsEstim[imet], kg[imet], "x1", "yEstim:vEstim");
        lkrig[imet]->solverLoop();

        //do the plot
        apad->cd(imet+1);
        PrintSolutions(tdsObs, tdsEstim[imet], Correl[imet]);

        stringstream sstr; TLatex *lat=new TLatex(); lat->SetNDC(); lat->SetTextSize(0.025);
        sstr.str(""); sstr << "RMSE (by Loo) " << kg[imet]->getLooRMSE();
        lat->DrawLatex(0.4,0.61,sstr.str().c_str());
        sstr.str(""); sstr << "Q2 " << kg[imet]->getLooQ2();
        lat->DrawLatex(0.4,0.57,sstr.str().c_str());
    }
}
The first function of this macro (called PrintSolutions) is a complex part that will not be
detailed, used to represent the results.
The macro itself starts by reading the training database and storing it in a dataserver. A
TGPBuilder is created with the chosen correlation function and the hyper-parameters are estimation
by an optimisation procedure in:
    gpb[imet] = new TGPBuilder(tdsObs, "x1", "y", Correl[imet].c_str(), "");
    gpb[imet]->findOptimalParameters("LOO", 100, "Subplexe", 1000);

    kg[imet] = gpb[imet]->buildGP();
The last line shows how to build and retrieve the newly created kriging object.
Finally, this kriging model is tested against the training database, thanks to a TLauncher2 object,
as following:
    lkrig[imet] = new TLauncher2(tdsEstim[imet], kg[imet], "x1", "yEstim:vEstim");
    lkrig[imet]->solverLoop();
13.6.14.3. Graph
Figure 13.45 Graph of the macro “modelerTestKriging.C”