2.5.7. Graph 2D “pairs”
This 2D graph consists in creating a matrix of graphs, where for the (i,j) cells with i different from j, the graph contains the scatterplot of the attribute j versus the attribute i, and for cell (i,i), the graph contains the histogram of the attribute i.
    TDataServer * tdsGeyser = new TDataServer("tdsgeyser", "Database of the geyser");
    tdsGeyser->fileDataRead("flowrateUniformDesign.dat");
    tdsGeyser->drawPairs();
Figure 2.49 Graphs of “Pairs” of the 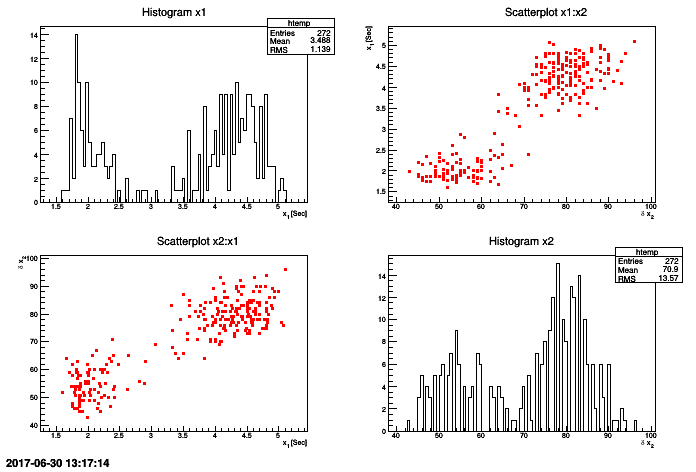
TDataServer geyser
Summary: 2D Graph
drawScatterplot(const char* varexp, const char* selection=””, Option_t* option=””)Draw 2D graph with the number of points of attributes located in varexp on the background.
drawProfile(const char* varexp, const char* selection=””, Option_t* option=””)Draw 2D graphic of the mean and standard deviation of each segment of “X” axis for the attributes contained in varexp.
Tip
The possible values of options option are:
- nclass=[0-9]*
Specifies the number of segments in “X” axis .
- same
Displays the 2D scatterplot below “profile”.
drawTufte(const char* varexp, const char* selection=””, Option_t* option=””)Draw 2D graph of the attributes located in
varexp .Tip
The possible values of options option are:
- optstat
Prints the window containing statistics in each histogram
- scatter
Prints the scatterplot the same way as the command drawScatterplot.
drawPairs(const char* varexp, const char* selection=””, Option_t* option=””)Create the matrix of graph with the attributes located in varexp.
It should be noticed that these functions have the same signature as the draw method of a
TTree of ROOT.
Warning
For all these methods, the character varexp must contain either two attributes or a single character “:”