2.5.4. Graph 2D with contour levels
When a 2D scatterplot is plotted, we do not automatically see the number of points falling in the same cell. To get an assessment of this information, the contour levels of the number of points have to be put in background and then it becomes possible to plot the classical scatterplot.
    TDataServer * tdsGeyser = new TDataServer("tdsgeyser", "Geyser database");
    tdsGeyser->fileDataRead("geyser.dat");
    tdsGeyser->drawScatterplot("x2:x1");
Figure 2.46 Scatterplot between attributes x1 and x2 of the 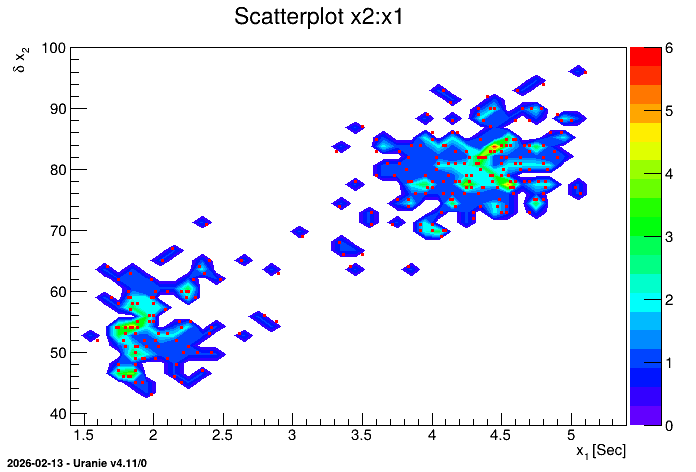
TDataServer geyser.
This figure has to be compared to the classical scatterplot shown, for instance, in Figure 2.4.