2.5.10. PP plot
Warning
This function requires the “mathmore” feature to have be installed along with your ROOT version. If not found, this function cannot be used and will return nothing but an equivalent to this message.
Once dealing with an unknown set of points, it is possible to compare it to known statistical law (among the following already implemented list: normal, uniform, weibull, gumbelmax, exponential, beta, gamma and lognormal). For instance, if one wants to compare “x2” variable from the geyser dataset to a normal law, one can have a look at the probabiliity distribution from the sample and compare it to the expected behaviour by following the steps below.
    TDataServer * tdsPP = new TDataServer("tdsPP", "Database of the PP");
    tdsPP->fileDataRead("geyser.dat"); // read data file
    tdsPP->computeStatistic(); // to estimate mu and sigma
    tdsPP->drawPPPlot("x2",Form("normal(%g,%g)",tdsPP->getAttribute("x2")->getMean(),tdsPP->getAttribute("x2")->getStd()),400);
Figure 2.53 Plot resulting from the “drawPPPlot” method, comparing “x2” to a normal distribution.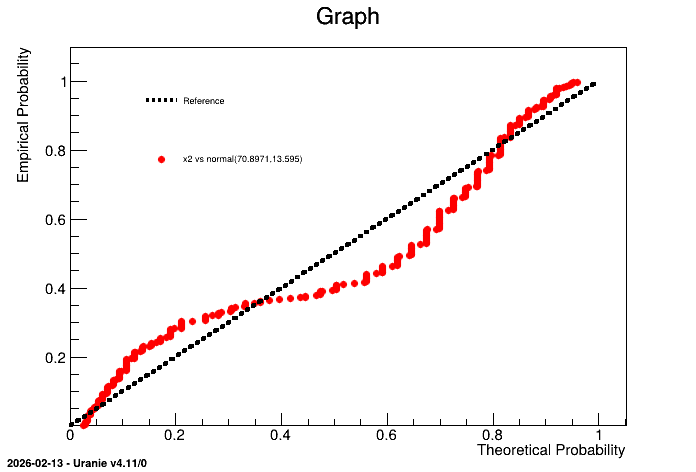
It is obvious here, that the “x2” law, clearly doesn’t seem to follow a normal law (which was pretty obvious by looking at Figure 2.48 for instance). An heavy use of this method is provided in Macro “dataserverDrawPPPlot.C”.