13.4.4. Macro “samplingQMC.py”
13.4.4.1. Objective
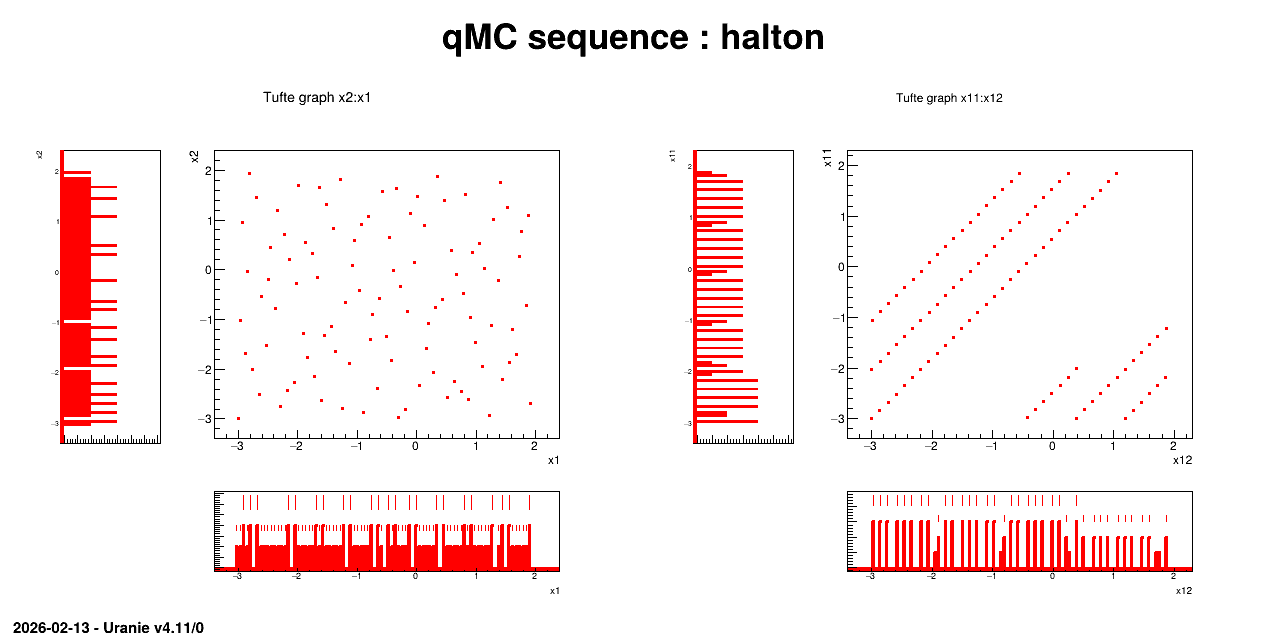
Generate a design-of-experiments of 100 patterns using quasi Monte-Carlo methods (“Halton” or “Sobol”) with 12 random attributes, following an uniform law on [3.,2.]. All these information are introduced by variables which will be used by the rest of the macro.
13.4.4.2. Macro Uranie
"""
Example of quasi monte-carlo generation
"""
from URANIE import DataServer, Sampler
import ROOT

# Parameters
nSampler = 100
sQMC = "halton"  # halton / sobol
nVar = 12

# Create a DataServer.TDataServer
tds = DataServer.TDataServer()

# Fill the DataServer with the nVar attributes of the study
for i in range(nVar):
    tds.addAttribute(DataServer.TUniformDistribution("x"+str(i+1), -3.0, 2.0))

# Generate the quasi Monte-Carlo sequence from the DataServer.TDataServer
qmc = Sampler.TQMC(tds, sQMC, nSampler)
qmc.generateSample()

# Visualisation
Canvas = ROOT.TCanvas("c1", "Graph for the Macro qmc", 5, 64, 1270, 667)
Canvas.Range(0, 0, 25, 18)

pl = ROOT.TPaveLabel(1, 16.3, 24, 17.5, "qMC sequence : "+sQMC, "br")
pl.SetBorderSize(0)
pl.Draw()

pad1 = ROOT.TPad("pad1", "Determ", 0.02, 0.05, 0.48, 0.88)
pad2 = ROOT.TPad("pad2", "Stoch", 0.52, 0.05, 0.98, 0.88)
pad1.Draw()
pad2.Draw()

pad1.cd()
tds.drawTufte("x2:x1")
pad2.cd()
tds.drawTufte("x11:x12")
Laws are set for each attribute and linked to a TDataServer:
for i in range(nVar):
    tds.addAttribute(DataServer.TUniformDistribution("x"+str(i+1), -3.0, 2.0))
The sampling is generated with the QMC method and a correlation is set between the two first attributes:
qmc = Sampler.TQMC(tds, sQMC, nSampler)
qmc.generateSample()
The rest of the code is used to produce a plot.
13.4.4.3. Graph
Figure 13.12 Graph of the macro “samplingQMC.py”