13.2.4. Macro “dataserverLoadASCIIFile.C”
13.2.4.1. Objective
Loading data in a TDataServer, using the “Salome-table” format of Uranie and applying basic
visualisation methods on attributes.
The data file is named "flowrateUniformDesign.dat" and data correspond to an Uniform design-of-experiments of
32 patterns for a “code” with 8 inputs (\(r_{\omega}\), \(r\), \(T_u\), \(T_l\), \(H_u\), \(H_l\), \(L\), \(K_{\omega}\)) along with a response (“yhat”). The data
file "flowrateUniformDesign.dat" is in the “Salome-table” format of Uranie.
#NAME: flowrateborehole
#TITLE: Uniform design of flow rate borehole problem proposed by Ho and Xu(2000)
#COLUMN_NAMES: rw| r| tu| tl| hu| hl| l| kw | ystar
#COLUMN_TITLES: r_{#omega}| r | T_{u} | T_{l} | H_{u} | H_{l} | L | K_{#omega} | y^{*}
#COLUMN_UNITS: m | m | m^{2}/yr | m^{2}/yr | m | m | m | m/yr | m^{3}/yr

0.0500 33366.67  63070.0 116.00 1110.00 768.57 1200.0 11732.14  26.18
0.0500   100.00  80580.0  80.73 1092.86 802.86 1600.0 10167.86  14.46
0.0567   100.00  98090.0  80.73 1058.57 717.14 1680.0 11106.43  22.75
0.0567 33366.67  98090.0  98.37 1110.00 734.29 1280.0 10480.71  30.98
0.0633   100.00 115600.0  80.73 1075.71 751.43 1600.0 11106.43  28.33
0.0633 16733.33  80580.0  80.73 1058.57 785.71 1680.0 12045.00  24.60
0.0700 33366.67  63070.0  98.37 1092.86 768.57 1200.0 11732.14  48.65
0.0700 16733.33 115600.0 116.00  990.00 700.00 1360.0 10793.57  35.36
0.0767   100.0  115600.0  80.73 1075.71 751.43 1520.0 10793.57  42.44
0.0767 16733.33  80580.0  80.73 1075.71 802.86 1120.0  9855.00  44.16
0.0833 50000.00  98090.0  63.10 1041.43 717.14 1600.0 10793.57  47.49
0.0833 50000.00 115600.0  63.10 1007.14 768.57 1440.0 11419.29  41.04
0.0900 16733.33  63070.0 116.00 1075.71 751.43 1120.0 11419.29  83.77
0.0900 33366.67 115600.0 116.00 1007.14 717.14 1360.0 11106.43  60.05
0.0967 50000.00  80580.0  63.10 1024.29 820.00 1360.0  9855.00  43.15
0.0967 16733.33  80580.0  98.37 1058.57 700.00 1120.0 10480.71  97.98
0.1033 50000.00  80580.0  63.10 1024.29 700.00 1520.0 10480.71  74.44
0.1033 16733.33  80580.0  98.37 1058.57 820.00 1120.0 10167.86  72.23
0.1100 50000.00  98090.0  63.10 1024.29 717.14 1520.0 10793.57  82.18
0.1100   100.00  63070.0  98.37 1041.43 802.86 1600.0 12045.00  68.06
0.1167 33366.67  63070.0 116.00  990.00 785.71 1280.0 12045.00  81.63
0.1167   100.00  98090.0  98.37 1092.86 802.86 1680.0  9855.00  72.5
0.1233 16733.33 115600.0  80.73 1092.86 734.29 1200.0 11419.29 161.35
0.1233 16733.33  63070.0  63.10 1041.43 785.71 1680.0 12045.00  86.73
0.1300 33366.67  80580.0 116.00 1110.00 768.57 1280.0 11732.14 164.78
0.1300   100.00  98090.0  98.37 1110.00 820.00 1280.0 10167.86 121.76
0.1367 50000.00  98090.0  63.10 1007.14 820.00 1440.0 10167.86  76.51
0.1367 33366.67  98090.0 116.00 1024.29 700.00 1200.0 10480.71 164.75
0.1433 50000.00  63070.0 116.00  990.00 785.71 1440.0  9855.00  89.54
0.1433 50000.00 115600.0  63.10 1007.14 734.29 1440.0 11732.14 141.09
0.1500 33366.67  63070.0  98.37  990.00 751.43 1360.0 11419.29 139.94
0.1500   100.00 115600.0  80.73 1041.43 734.29 1520.0 11106.43 157.59
13.2.4.2. Macro Uranie
    // Create a TDataServer
    TDataServer * tds = new TDataServer();

    TCanvas  *Canvas = new TCanvas("c1", "Graph for the Macro loadASCIIFile",5,64,1270,667);
    TPad *pad = new TPad("pad","pad",0, 0.03, 1, 1);

    // Load the data base in the DataServer
    tds->fileDataRead("flowrateUniformDesign.dat");

    // Graph
    pad->Draw();
    pad->Divide(2,2);

    pad->cd(1); tds->draw("ystar");
    pad->cd(2); tds->draw("ystar:rw");
    pad->cd(3); tds->drawTufte("ystar:rw");
    pad->cd(4); tds->drawProfile("ystar:rw");

    tds->startViewer();
13.2.4.3. Graph
Figure 13.3 Graph of the macro 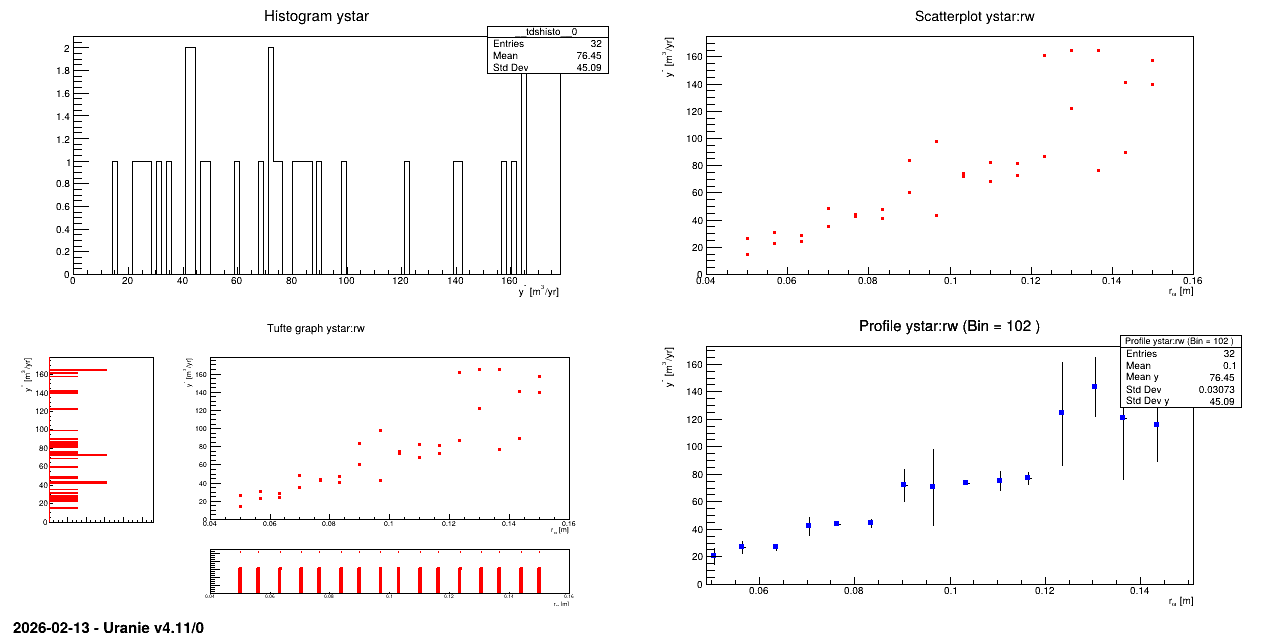
"dataserverLoadASCIIFile.C"