13.3.11. Macro “samplingMaxiMinLHSFromLHSGrid.C”
13.3.11.1. Objective
This macro shows the usage of the TMaxiMinLHS class in the case where it is used with an already
provided LHS grid. The class itself can generate a LHS grid from scratch (on which the simulated
annealing algorithm will be applied to get a maximin grid) but the idea for this macro is to do this
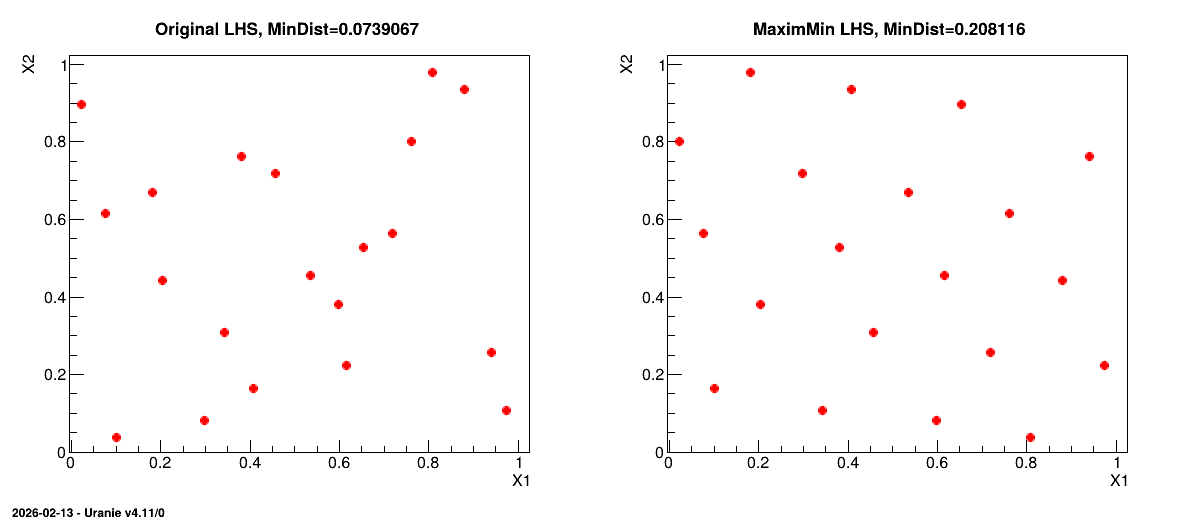
procedure in two steps to be able to compare the original LHS grid and the results of the
optimisation. The orginal design-of-experiments is done with two uniformly-distributed variables.
The resulting design-of-experiments presented is presented side-by-side with the original one and the mindist criterion calculated is displayed on top of both grid, for illustration purpose.
13.3.11.2. Macro Uranie
void niceplot(TDataServer *tds, TLatex *lat, string Title)
{

    tds->getTuple()->SetMarkerStyle(20); tds->getTuple()->SetMarkerSize(1);
    tds->Draw("X2:X1");
    stringstream sstr; sstr.str("");
    sstr<<Title<<", MinDist="<<TMaxiMinLHS::getMinDist(tds->getMatrix());
    ((TH2F*)gPad->GetPrimitive("__tdshisto__0"))->SetTitle( "" );
    ((TH2F*)gPad->GetPrimitive("__tdshisto__0"))->GetXaxis()->SetRangeUser(0.,1.);
    ((TH2F*)gPad->GetPrimitive("__tdshisto__0"))->GetYaxis()->SetRangeUser(0.,1.);
    lat->DrawLatex(0.25,0.94,sstr.str().c_str());

}

void samplingMaxiMinLHSFromLHSGrid(const string& figure="figure.png", const string& style="",
    int seed_sampling=0, int seed_lhs=0)
{
    // Canvas to produce the 2x1 plot to compare LHS designs
    TCanvas *Can = new TCanvas("Can","Can",10,32,1200,550);
    TPad *pad = new TPad("pad","pad",0, 0.03, 1, 1);
    pad->Draw();
    pad->Divide(2,1);

    int size = 20; // Size of the samples to be produced
    TLatex *lat = new TLatex(); lat->SetNDC(); lat->SetTextSize(0.038); // To write titles

    // Create dataserver and define the attributes
    TDataServer *tds = new TDataServer("tds","pouet");
    tds->addAttribute( new TUniformDistribution("X1",0,1) ); tds->getAttribute("X1")->delShare(); // Define attribute and state to tds that it owns it
    tds->addAttribute( new TUniformDistribution("X2",0,1) ); tds->getAttribute("X2")->delShare(); // Define attribute and state to tds that it owns it

    // Generate the original LHS grid
    TSampling *sampl = new TSampling(tds,"lhs",size);
    sampl->generateSample();

    // Display it
    pad->cd(1);
    niceplot(tds, lat, "Original LHS");

    // Transform the grid in a maximin LHD
    // Set initial temperature to 0.1, c factor to 0.99 and loop limitations to 300 following official recommandation in methodology manual
    TMaxiMinLHS *maxim = new TMaxiMinLHS(tds, size, 0.1, 0.99, 300, 300);
    maxim->generateSample();

    // Display it
    pad->cd(2);
    niceplot(tds, lat, "MaximMin LHS");
}
The macro very much looks like any other design-of-experiments generating macro above: the dataserver is created and
the problem is defined along with the input variables. A LHS grid is generated through the use of
TSampling and display in the first part of the canvas, calling a generic function niceplot
defined on top of this macro. The new part comes with the following lines:
    // Transform the grid in a maximin LHD
    // Set initial temperature to 0.1, c factor to 0.99 and loop limitations to 300 following official recommandation in methodology manual
    TMaxiMinLHS *maxim = new TMaxiMinLHS(tds, size, 0.1, 0.99, 300, 300);
    maxim->generateSample();
The construction line of a TMaxiMinLHS is a bit different from the usual TSampling object: on
top of a pointer to the dataserver, it requires the size of the grid to be generated and the main
characteristic of the simulated annealing method to be used for the optimisation of the mindist
criteria. A more complete discussion is done on this subject in [Bla17]
13.3.11.3. Graph
Figure 13.14 Graph of the macro “samplingMaxiMinLHSFromLHSGrid.C”