2.5.6. Graph 2D “Tufte”
This 2D graph consists in plotting the scatterplot of the two attributes, and also plotting each of the two histograms of the attributes in X and Y, respectively below or on the left of the scatterplot.
tdsGeyser = DataServer.TDataServer("tdsgeyser", "Database of the geyser")
tdsGeyser.fileDataRead("geyser.dat")
tdsGeyser.drawTufte("x2:x1")
Figure 2.48 Graphs of “Tufte” type between the attributes x1 and x2 of the 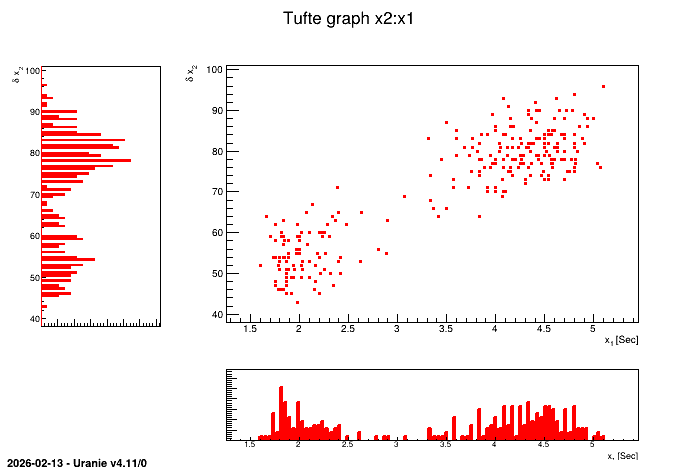
TDataServer geyser.