2.5.8. Graph “CobWeb”
For multidimensional problem, the drawPairs method is limited to spot correlation because of the
way the output looks. For instance in a problem with 8 uniformly-distributed inputs and one output,
one can get a graphic as the one shown in Figure 2.50 (obtained with
the code below). No special trend can be seen here.
tdsCobweb = DataServer.TDataServer("tdscobweb", "Database of the cobweb")
tdsCobweb.fileDataRead("cobwebdata.dat") # read data file
tdsCobweb.drawPairs() # do the drawPairs graph
Figure 2.50 Graphs of “drawPairs” type between the 8 uniformly-distributed inputs and the output of a
given problem.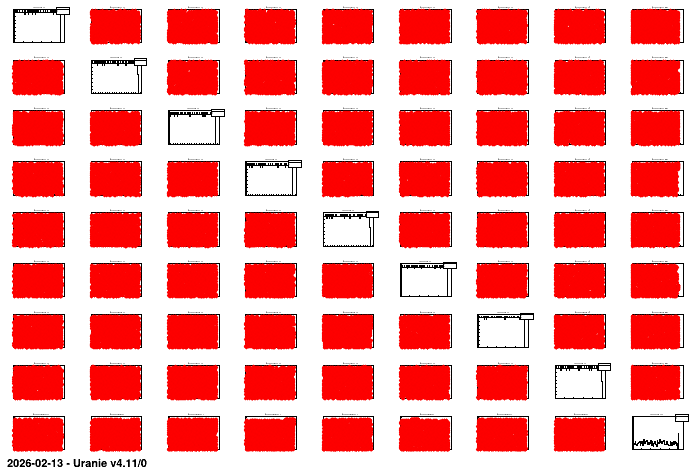
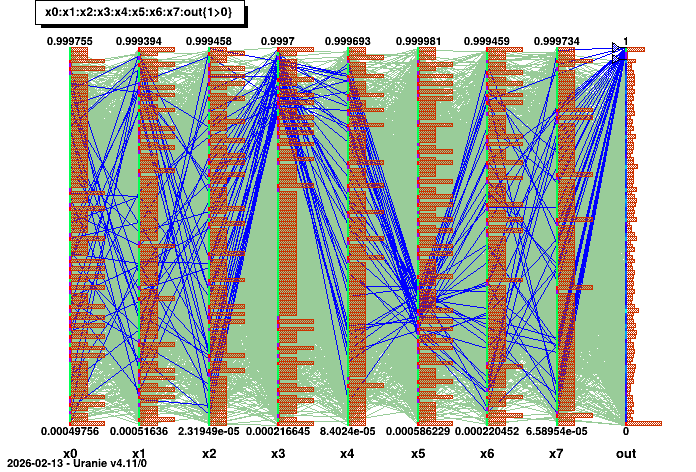
The “CobWeb” multidimensional graph, on the other hand, consists in plotting every dimension on a vertical axis and connecting all the points for a single event with a straight line. It is particularly useful to spot correlation in high-dimension problems as it is simple to highlight a certain region (by changing the colour for instance) to see if the rest of the variable are randomly distributed or not.
# Draw the cobweb plot
tdsCobweb.drawCobWeb("x0:x1:x2:x3:x4:x5:x6:x7:out") # Draw the cobweb

# Get the parallel coordination part to perform modification
para = ROOT.gPad.GetListOfPrimitives().FindObject("__tdspara__0")
# Get the output axis
axis = para.GetVarList().FindObject("out")

# Create a range for 0.97 < out < 1.0 and display it in blue
Range  = ROOT.TParallelCoordRange(axis, 0.97, 1.0)
axis.AddRange(Range)
para.AddSelection("blue")
Range.Draw()
This code for instance specifies a region-of-interest in the output, when the value are greater than 0.97. A correlation is highlighted between these values and a region, for which the fourth input variable has high value while the sixth input variable values lie between 0.2 and 0.4. The result of this code is shown in Figure 2.51.
Figure 2.51 Graphs of “CobWeb” type between the 8 uniformly-distributed inputs and the output of a given
problem.