13.7.3. Macro “modelerFlowrateMultiLinearRegression.py”
13.7.3.1. Objective
The objective of the macro is to build a multilinear regression between the predictors \(r_{\omega}\), \(r\), \(T_u\), \(T_l\), \(H_u\), \(H_l\), \(L\), \(K_{\omega}\)
and a target variable yhat from the database contained in the ASCII file
flowrate_sampler_launcher_500.dat defining values for these eight variables described in
Presentation of the problem on 500 patterns. Parameters of the regression are then
exported in a .py file _FileContainingFunction_.C:
void MultiLinearFunction(double *param, double *res)
{
  //////////////////////////////
  //
  //     *********************************************
  //     ** Uranie v3.12/0 -  Date : Thu Jan 04, 2018
  //     ** Export Modeler : Modeler[LinearRegression]Tds[tdsFlowrate]Predictor[rw:r:tu:tl:hu:hl:l:kw]Target[yhat]
  //     ** Date : Tue Jan  9 12:08:27 2018

  //     *********************************************
  //
  //     *********************************************
  //     ** TDataServer
  //     **        Name  : tdsFlowrate
  //     **        Title : Design of experiments for Flowrate
  //     **     Patterns : 500
  //     **   Attributes : 10
  //     *********************************************
  //
  //     INPUT  : 8
  //             rw : Min[0.050069828419999997] Max[0.14991758599999999] Unit[]
  //             r : Min[147.90551809999999] Max[49906.309529999999] Unit[]
  //             tu : Min[63163.702980000002] Max[115568.17200000001] Unit[]
  //             tl : Min[63.169232649999998] Max[115.90147020000001] Unit[]
  //             hu : Min[990.00977509999996] Max[1109.786159] Unit[]
  //             hl : Min[700.14498509999999] Max[819.81105760000003] Unit[]
  //             l : Min[1120.3428429999999] Max[1679.3424649999999] Unit[]
  //             kw : Min[9857.3689890000005] Max[12044.00546] Unit[]
  //
  //     OUTPUT : 1
  //             yhat : Min[13.09821] Max[208.25110000000001] Unit[]
  //
  //////////////////////////////
  //
  //     QUALITY  :
  //
  //              R2  = 0.948985
  //              R2a = 0.948154
  //              Q2  = 0.946835
  //
  //////////////////////////////

  // Intercept
  double y = -156.03;

  // Attribute : rw
  y += param[0]*1422.21;

  // Attribute : r
  y += param[1]*-3.07412e-07;

  // Attribute : tu
  y += param[2]*2.15208e-06;

  // Attribute : tl
  y += param[3]*-0.00498512;

  // Attribute : hu
  y += param[4]*0.261104;

  // Attribute : hl
  y += param[5]*-0.254419;

  // Attribute : l
  y += param[6]*-0.0557145;

  // Attribute : kw
  y += param[7]*0.00813552;

  // Return the value
  res[0] = y;
}
This file contains a MultiLinearFunction function. Comparison is made with a database generated
from random variables obeying uniform laws and output variable calculated with this database and the
MultiLinearFunction function.
13.7.3.2. Macro Uranie
"""
Example of multi-linear regression on flowrate
"""
from URANIE import DataServer, Launcher, Modeler, Sampler
import ROOT
tds = DataServer.TDataServer()
tds.fileDataRead("flowrate_sampler_launcher_500.dat")
c = ROOT.TCanvas("c1", "Graph for the Macro modeler", 5, 64, 1270, 667)
tlin = Modeler.TLinearRegression(tds, "rw:r:tu:tl:hu:hl:l:kw",
"yhat", "DummyForPython")
tlin.estimate()
tlin.exportFunction("c++", "_FileContainingFunction_", "MultiLinearFunction")
# Define the DataServer
tds2 = DataServer.TDataServer("tdsFlowrate", "Design of experiments")
# Add the study attributes
tds2.addAttribute(DataServer.TUniformDistribution("rw", 0.05, 0.15))
tds2.addAttribute(DataServer.TUniformDistribution("r", 100.0, 50000.0))
tds2.addAttribute(DataServer.TUniformDistribution("tu", 63070.0, 115600.0))
tds2.addAttribute(DataServer.TUniformDistribution("tl", 63.1, 116.0))
tds2.addAttribute(DataServer.TUniformDistribution("hu", 990.0, 1110.0))
tds2.addAttribute(DataServer.TUniformDistribution("hl", 700.0, 820.0))
tds2.addAttribute(DataServer.TUniformDistribution("l", 1120.0, 1680.0))
tds2.addAttribute(DataServer.TUniformDistribution("kw", 9855.0, 12045.0))
nS = 1000
# Generate DOE
sampling = Sampler.TSampling(tds2, "lhs", nS)
sampling.generateSample()
ROOT.gROOT.LoadMacro("_FileContainingFunction_.C")
# Create a TLauncherFunction from a TDataServer and an analytical function
# Rename the outpout attribute "ymod"
tlf = Launcher.TLauncherFunction(tds2, "MultiLinearFunction", "", "ymod")
# Evaluate the function on all the design of experiments
tlf.run()
tds2.getTuple().SetMarkerColor(ROOT.kBlue)
tds2.getTuple().SetMarkerStyle(8)
tds2.getTuple().SetMarkerSize(1.2)
tds.getTuple().SetMarkerColor(ROOT.kGreen)
tds.getTuple().SetMarkerStyle(8)
tds.getTuple().SetMarkerSize(1.2)
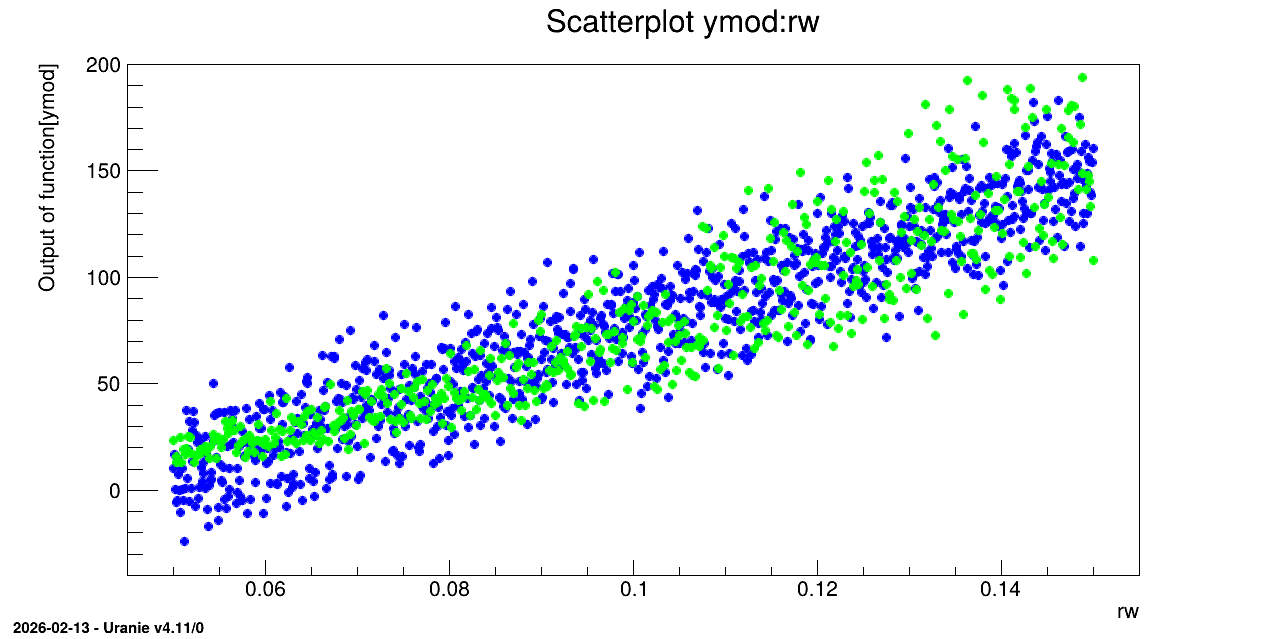
tds2.draw("ymod:rw")
tds.draw("yhat:rw", "", "same")
The TDataServer is loaded with the database contained in the file flowrate_sampler_launcher_500.dat
with the fileDataRead method:
tds = DataServer.TDataServer()
tds.fileDataRead("flowrate_sampler_launcher_500.dat")
The linear regression is initialised and characteristic values are computed for each variable with
the estimate method:
tlin = Modeler.TLinearRegression(tds, "rw:r:tu:tl:hu:hl:l:kw",
                                 "yhat", "DummyForPython")
tlin.estimate()
The last argument is the option field, which in most cases is empty. Here it is filled with
“DummyPython” which helps specify to python which constructor to choose. There are indeed several
possible constructors these 5 five first arguments, but C++ can make the difference between them as
the literal members are either std::string, ROOT::TString, Char_t* or even Option_t*. For
python, these format are all PyString, so the sixth argument is compulsory to disentangle the
possibilities.
The model is exported in an external file in C++ language _FileContainingFunction_.C where the
function name is MultiLinearFunction:
tlin.exportFunction("c++", "_FileContainingFunction_", "MultiLinearFunction")
A second TDataServer is created. The previous variables then obey uniform laws and are linked as
TAttribute in this new TDataServer:
tds2.addAttribute(DataServer.TUniformDistribution("rw", 0.05, 0.15))
tds2.addAttribute(DataServer.TUniformDistribution("r", 100.0, 50000.0))
tds2.addAttribute(DataServer.TUniformDistribution("tu", 63070.0, 115600.0))
tds2.addAttribute(DataServer.TUniformDistribution("tl", 63.1, 116.0))
tds2.addAttribute(DataServer.TUniformDistribution("hu", 990.0, 1110.0))
tds2.addAttribute(DataServer.TUniformDistribution("hl", 700.0, 820.0))
tds2.addAttribute(DataServer.TUniformDistribution("l", 1120.0, 1680.0))
tds2.addAttribute(DataServer.TUniformDistribution("kw", 9855.0, 12045.0))
A sampling is realised with a LHS method on 1000 patterns:
sampling = Sampler.TSampling(tds2, "lhs", nS)
sampling.generateSample()
The previously exported macro _FileContainingFunction_.C is loaded so as to perform calculation
over the database in the second TDataServer with the function MultiLinearFunction. Results are stored
in the ymod variable:
ROOT.gROOT.LoadMacro("_FileContainingFunction_.C")
tlf = Launcher.TLauncherFunction(tds2, "MultiLinearFunction", "", "ymod")
tlf.run()
13.7.3.3. Graph
Figure 13.39 Graph of the macro “modelerFlowrateMultiLinearRegression.py”