

Documentation
/ Methodological guide
: 
| V.3. The regression method | ||
|---|---|---|
 | Chapter V. Sensitivity analysis |  |
The estimation is done by estimating the correlation matrix of the output understudy with the different inputs,
leading to a matrix  which can be based on values (for SRC and PCC) or on ranks (for SRRC and PRCC). Once this matrix is
estimated, it is inverted and the requested coefficients are estimated using the following relations (established in
Ref [Iman85] and given here only for illustration purpose):
which can be based on values (for SRC and PCC) or on ranks (for SRRC and PRCC). Once this matrix is
estimated, it is inverted and the requested coefficients are estimated using the following relations (established in
Ref [Iman85] and given here only for illustration purpose):
 for standard regression coefficients
 for partial regression
coefficients
for partial regression
coefficients
where  and
and  being respectively the number of the input and
output under study in the correlation matrix. An important factor for the quality of the regression coefficients is
the quality of the model which can be asserted with the value of the
being respectively the number of the input and
output under study in the correlation matrix. An important factor for the quality of the regression coefficients is
the quality of the model which can be asserted with the value of the  and the
  factors defined in Equation IV.1 and whose computation is
performed as followed:
factors defined in Equation IV.1 and whose computation is
performed as followed:
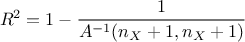
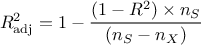
It can be considered that and
must be superior
to 0.7-0.8 in order to use the regression coefficients. However, these values are not guaranteed-threshold, one should
be careful not to only rely on them to state that the underlying hypothesis is correct or not.
When considering SRC, one can rely on the equality introduced in Section V.1.1.1:
 , where
 is the Pearson
coefficient between the output and the i-Th input. This is interesting, as uncertainty on the estimation of a
correlation coefficient can be computed from Fisher's z-transformation [Fisher1921] under certain
hypothesis. Given a certain sample of size N, the empirical estimation
is the Pearson
coefficient between the output and the i-Th input. This is interesting, as uncertainty on the estimation of a
correlation coefficient can be computed from Fisher's z-transformation [Fisher1921] under certain
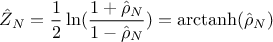
hypothesis. Given a certain sample of size N, the empirical estimation  of a true correlation
  between two normal-distributed variables (independent and
identically distributed) can be transformed into
between two normal-distributed variables (independent and
identically distributed) can be transformed into  following this recipe:
The nice property of this newly-defined variable is that it follows asymptotically a normal distribution of mean
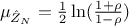 and standard deviation
 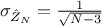 . It is particularly
appealing to notice that the standard deviation is independent of the correlation value itself, and only depends on
the number of points provided in the initial sample. From there, in order to get a 95% confidence level on the
correlation coefficient, one can start from this equation
. It is particularly
appealing to notice that the standard deviation is independent of the correlation value itself, and only depends on
the number of points provided in the initial sample. From there, in order to get a 95% confidence level on the
correlation coefficient, one can start from this equation
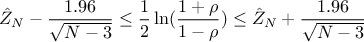
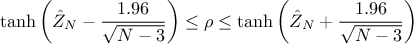
and invert it to get the 95% confidence interval on the correlation coefficient itself, defined as
This procedure would be fine if the quantity of interest was the correlation coefficient, but in our case, we're
interested in the square value of this coefficient. To extrapolate the confidence interval on the correlation
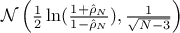
coefficient into a proper confidence interval on its squared value, we draw a large sample (of size  ) of
) of 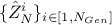 , following
the expected asymptotic behaviour of the Fisher's z-transformed variable but using the estimated value
instead of
the true one :
, following
the expected asymptotic behaviour of the Fisher's z-transformed variable but using the estimated value
instead of
the true one :
 . This set of
points is transformed into new coefficients which
are squared in order to get a set of squared-correlation coefficients. From this set, the 2.5% and 97.5% quantile are estimated leading
to a resulting 95% confidence interval on the squared-value of the estimated correlation coefficient
. This set of
points is transformed into new coefficients which
are squared in order to get a set of squared-correlation coefficients. From this set, the 2.5% and 97.5% quantile are estimated leading
to a resulting 95% confidence interval on the squared-value of the estimated correlation coefficient  (and thus on its
Sobol interpretation in the linear case).
(and thus on its
Sobol interpretation in the linear case).
This procedure has been tested using an linear analytic model (for which it is possible to estimate the expected SRC coefficients) with normal-distributed independent and identically distributed inputs variables. Ten thousand design-of-experiments were generated and the theoretical Sobol indices were included in the estimated confidence interval in 95% of the cases. Running the same protocole with uniform distributions instead of normal ones, the theoretical Sobol indices were in the estimated confidence interval between 95% and 98% of the cases. This illustrate the fact that the resulting confidence interval can be considered exact only if the hypothesis stated above are respected. If not, it anyways provides an interesting insight on the way the estimation converges, without being a quantifiable range.
Finally, the procedure described above relies on the Pearson coefficient, to get an estimation of a confidence interval for Sobol indices in linear model. The exact same procedure can be followed using the Spearman correlation coefficient, which leads then to an estimation of a confidence interval for Sobol indices in monotonic model.
| |  | |
| V.2. The finite differences method |  | V.4. The Morris screening method |