

Documentation
/ User's manual in Python
: 
| VI.3. The regression method | ||
|---|---|---|
 | Chapter VI. The Sensitivity module |  |
The TRegression class is dealing with computing the SRC and SRRC coefficients but also the
PCC and PRCC ones (for a definition of these coefficients, see [metho]). The choice of which values to be computed between these four is
set at the construction by precising respectively "src", "srrc", "pcc" or "prcc" and is no more inclusive. It is
indeed now possible to get, for example, the results of both SRC and PRCC estimation by passing the option "srcprcc",
for one or more outputs. This class computes the regression coefficients from the
observations of the model contained in a TDataServer. The construction of the data sample is the user burden and the
quality of the regression coefficients computed will depend upon it (unless analysing a dataset out of an
experiment).
In the case where SRC or SRRC coefficients are requested, a second estimation is performed, based on correlation coefficients (between the output and the input under consideration, see [metho] for completness). This estimation is costless and allows to get an idea of the 95% confidence-interval (CI) of the estimated coefficient. This CI has to be considered as a very good guess of the 95% CI and could only be considered exact, if one respects the underlying hypothesis for its estimation: all input variables should be gaussian-distributed variables. An illustration of the way to look at this CI is shown in Section VI.3.2.5.1.
Using the TRegression class is simple, as there is only one possible creator, and the only
other method to be called is computeIndexes. The rest is common to any of the following
SA classes.
Computing Standardised Regression Coefficients (SRC),
Standardised Rank-Regression Coefficients (SRRC), partial
correlation coefficient (PCC) and partial rank correlation coefficient (PRCC) in Uranie is dealt with the TRegression class which inherits from the TSensitivity class. The following sections will explain how to compute and handle
the requested coefficients.
The example script uses the TRegression class to compute
and display the SRC and SRRC coefficients:
"""
Example of SRC and SRRC estimation
"""
from rootlogon import ROOT, DataServer, Sensitivity

# Define the DataServer and fill it with datas in a file
tds = DataServer.TDataServer("tdsflowrate", "DataBase flowrate")
tds.fileDataRead("sampleLHSFlowrateModel4000points.dat")

# Create a TRegression object and compute indexes
treg = Sensitivity.TRegression(tds, "rw:r:tu:tl:hu:hl:l:kw",
                               "flowrateModel", "SRCSRRC")
treg.computeIndexes()

# Draw SRC Indexes
cc = ROOT.TCanvas("canpie-SRC", "Pie chart SRC", 10, 32, 1200, 800)
apad = ROOT.TPad("apad", "apad", 0, 0.03, 1, 1)
apad.Draw()
apad.cd()
treg.drawIndexes("Flowrate", "", "nonewcanv, pie, SRC")

# Draw SRRC Indexes
ccc = ROOT.TCanvas("canpie-SRRC", "Pie chart SRRC", 10, 32, 1200, 800)
pad2 = ROOT.TPad("pad2", "pad2", 0, 0.03, 1, 1)
pad2.Draw()
pad2.cd()
treg.drawIndexes("Flowrate", "", "nonewcanv,pie,SRRC")
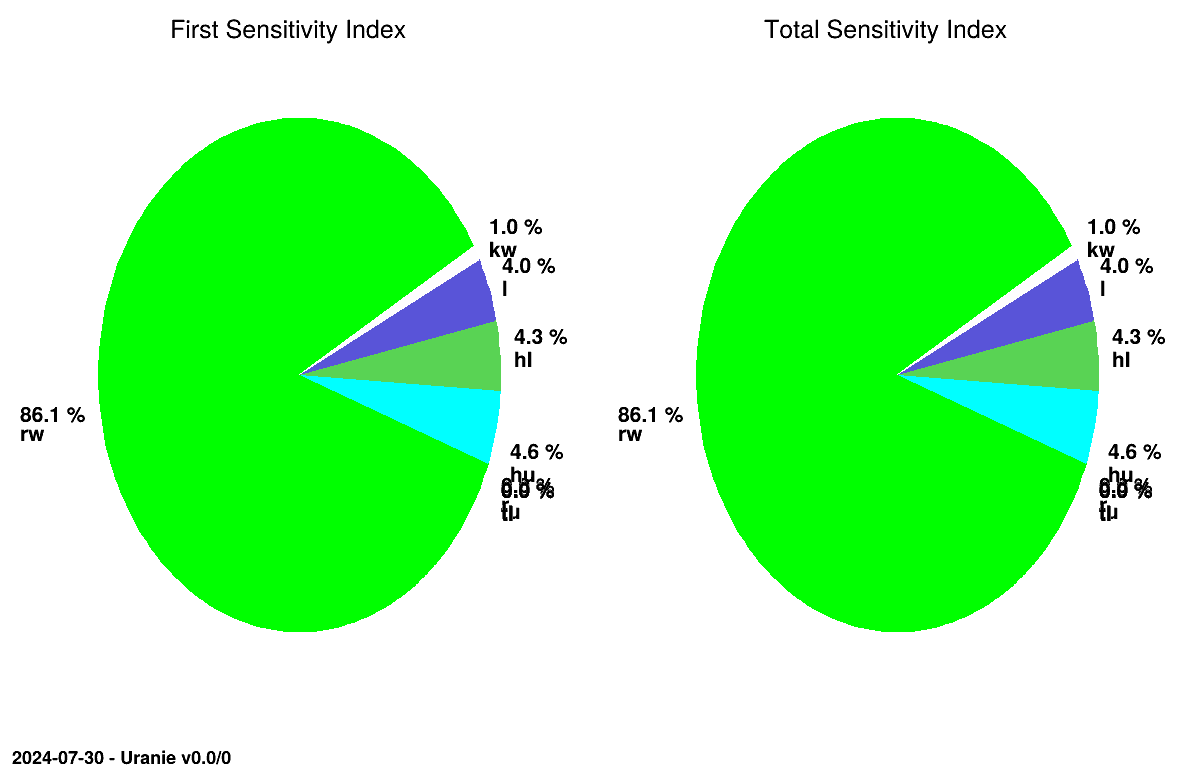
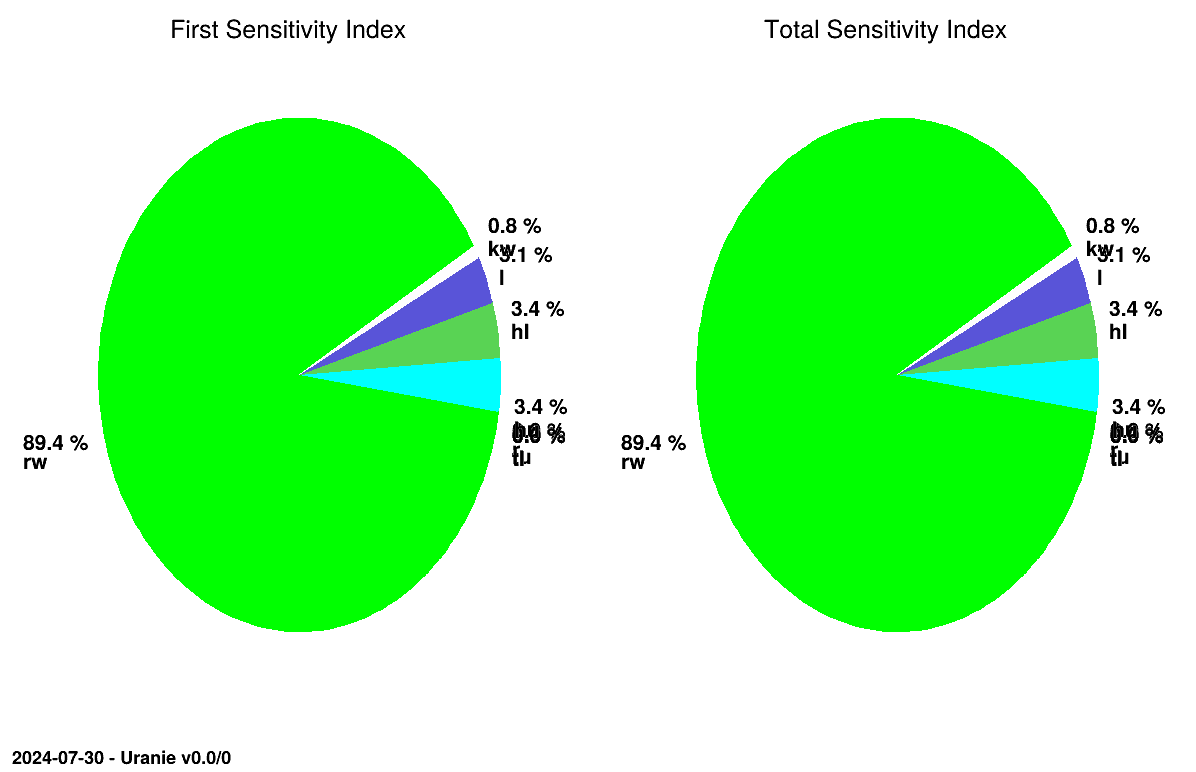
In this script, the observations are data loaded from a file into a TDataServer object, a TRegression object is created to compute the coefficients. Then both
indices are computed by using the method TSensitivity::computeIndexes. Finally, SRC and SRRC
coefficients are graphically displayed in pie charts, respectively in Figure VI.1 and Figure VI.2, with the
TSensitivity::drawIndexes method.
To build a TRegression object, use the following
constructor:
TRegression(tds, varinput, varoutput, option = "src")The TRegression constructor needs:
- a pointer to a
TDataServerobject where the input and output attributes are stored, - a string containing the input parameter names separated by colons (ex. "rw:r:tu:tl:hu:hl:l:kw"),
- a string containing the name of the model's outputs (ex. "flowrateModel"),
- a string containing the type of coefficient to compute ("SRC", "SRRC", "PCC", or "PRCC"), its default value is the string "SRC".
The creation of a TRegression object for computing the
SRC and the SRRC coefficients is therefore:
# Create a TRegression object and compute SRC indices
treg = Sensitivity.TRegression(tds, "rw:r:tu:tl:hu:hl:l:kw", "flowrateModel", "SRCSRRC")
The computation of the coefficients (also call indices) is done with the method
computeIndexes:
computeIndexes(option)In our example, its use is therefore:
# Compute the indices
treg.computeIndexes()
To display graphically the coefficients, use the drawIndexes method:
drawIndexes(sTitre, select, option)The method needs:
- a
TStringcontaining the title of the figure, - a string containing a selection (empty if no selection),
- a string containing the options of the graphics separated by commas.
Some of the options available are:
- "nonewcanv": to not create a new canvas,
- "pie": to display a pie chart,
- "hist": to display a histogram,
- "SRC": to display the SRC indices,
- "SRRC": to display the SRRC indices,
- "PCC": to display the PCC indices,
- "PRCC": to display the PRCC indices,
In our example the use of this method is:
# Draw SRC Indices
cc = ROOT.TCanvas("canpie-SRC", "Pie chart SRC")
treg.drawIndexes("Flowrate", "", "nonewcanv,pie,SRC")

# Draw SRRC Indices
ccc = ROOT.TCanvas("canpie-SRRC", "Pie chart SRRC")
treg.drawIndexes("Flowrate", "", "nonewcanv,pie,SRRC")
Here is another example with a histogram figure:
cccc = ROOT.TCanvas("canhist-SRC", "Hist chart SRC")
treg.drawIndexes("Flowrate", "", "nonewcanv,hist,first")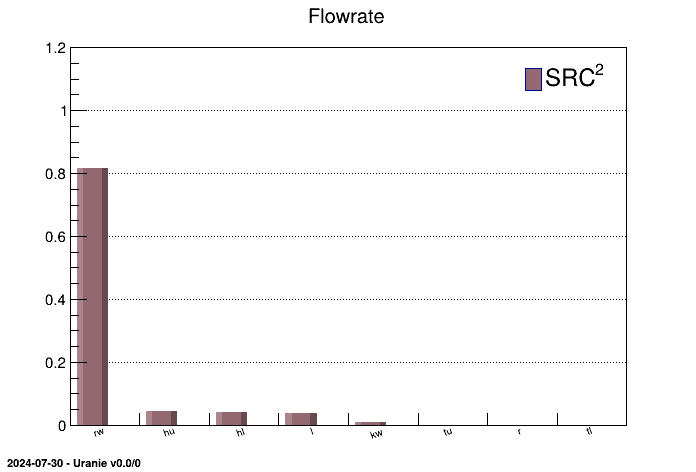
The coefficients, once computed, are stored in a TTree. To get this TTree,
use the method TSensitivity::getResultTuple():
results = treg.getResultTuple()
Several methods exist in ROOT to extract data from a TTree, it is advised to look for them into the ROOT documentation.
We propose two ways of extracting the value of each coefficient from the TTree.
The first method use the method getValue of the TRegression object specifying the
order of the extract value, the related input and possibly more selected options.
Rw_Indexe = treg.getValue("First","hl");The second method uses 3 steps to extract an index:
-
scan the
TTreefor the chosen input variable (with a selection) in order to obtain its row number. In our example, if we chose the variable "hl", we'll use the command:
This results in the following table, in which the SRC coefficient of "hl" is in the row 40:results.Scan("*", "((Inp==\"hl\")&&(Method==\"SRC^2\"))")************************************************************************************** * Row * Out * Inp * Order * Method * Algo * Value * CILower * CIUpper * ************************************************************************************** * 40 * flowr * hl * First * SRC^2 * --first-- * 0.04102 * -1 * -1 * * 41 * flowr * hl * Total * SRC^2 * --total-- * 0.04102 * -1 * -1 * * 42 * flowr * hl * First * SRC^2 * --rho^2-- * 0.04124 * 0.03025 * 0.05353 * * 43 * flowr * hl * Total * SRC^2 * --rho^2-- * 0.04124 * 0.03025 * 0.05353 * **************************************************************************************
The numbers stored in row 42 are the estimation using the correlation coefficient between the output and the input under consideration, and they are shown to crosscheck the main estimation and to display the estimated 95% confidence interval (CI), see Section VI.3.1 and [metho] for more explanations. -
set the entry of the
TTreeon this row with the methodGetEntry; -
get the value of the index with
GetValuemethod on the "Value" leaf of theTTree.
Below is an example of extraction of the index for the variable "hl" in our flowrate case:
results.Scan("*", "((Inp==\"hl\")&&(Method==\"SRC^2\"))")
results.GetEntry(20)
Rw_Indexe = results.GetLeaf("Value").GetValue()The second method uses 2 steps to extract an index:
-
use the
Drawmethod with a selection to select the index, for example the selection for the SRC coefficient of "rw" is "Inp==\"rw\" && Algo==\"--first--\""; -
get the pointer on the value of the index with the
GetV1method on theTTree.
Below is another example of extraction of the index for the variable "rw" in our flowrate case:
results.Draw("Value", "Inp==\"rw\" && Algo==\"--first--\" && Method==\"SRC^2\" ", "goff")
Rw_Indexe = results.GetV1()[0]
To evaluate the pertinence of the indices, it is recommended to check the value of both  and
and  . The use of the methods
TRegression::getR2 and TRegression::getR2A is now deprecated: as one can
work both on rank and values at the same time, the quality criteria can be computed for all the estimations and so
they have to be kept in the ntuple result as well. The numerical values can then be retrieved as previously
explained, an example is shown below to get the one from the regression on values (SRC).
Example:
# coefficient of determination R2
results.Draw("Value", "Inp==\"__R2__\" && Algo==\"--first--\" && Method==\"SRC^2\" ", "goff")
Rw_Indexe = results.GetV1()[0]

# adjusted coefficient of determination R2A
results.Draw("Value", "Inp==\"__R2A__\" && Algo==\"--first--\" && Method==\"SRC^2\" ", "goff")
Rw_Indexe = results.GetV1()[0]As stated in [metho], it can be interesting to consider the sum of the squared indices (in particular for SRC coefficients). As for the quality criteria, discussed previously, this computation can be done for all the estimations and so it has to be kept in the ntuple result. The numerical values can then be retrieved as previously explained, an example is shown below to get the ones from the regression on values (SRC).
Example:
# coefficient of determination sum
results.Draw("Value", "Inp==\"__sum__\" && Algo==\"--first--\" && Method==\"SRC^2\" ", "goff")
Rw_Indexe = results.GetV1()[0] | |  | |
| VI.2. The finite differences method |  | VI.4. The Morris screening method |