

Documentation
/ User's manual in Python
: 
| VI.4. The Morris screening method | ||
|---|---|---|
 | Chapter VI. The Sensitivity module |  |
The Morris method is an effective screening procedure
that robustifies a bit the OAT protocol (One-factor-At-a-Time, see Section III.6.1). Instead of varying every input parameters only
once (leading then to a minimum of  assessments of the code/function, with an OAT technique), the Morris method repeats this OAT
principle
assessments of the code/function, with an OAT technique), the Morris method repeats this OAT
principle  times. More precision on this method can be found in [metho]. The resulting cost (in terms of assessment number)
is then
times. More precision on this method can be found in [metho]. The resulting cost (in terms of assessment number)
is then  .
.
The results are usually visualised in the ( ,
, )
plane, allowing to sort its inputs in the following categories:
)
plane, allowing to sort its inputs in the following categories:
factors that have negligible effects on the output: both
and are small.
factors that have linear effects, without interaction with other inputs:
is large (all variations have an impact) but
is small (the
impact is the same independently of the starting point).
factors that have non-linear effects and/or interaction with other inputs: both
and are large.
In terms of implementation, there are only few methods that can be called once the TMorris
object is constructed (constructed either with a code, a function or an already-filled TDataServer):
generateSample:it produces the different patterns of OATcomputeIndexes:it computes the indices and stores them in the resultTTree.drawIndexes:the results are presented in the ( ,) plane, unless the option "mustar" is used to get as X axis instead.
Warning
If the TMorris object is constructed to run a function, the output used for the estimation
will be the first output provided by the function, unless the sixth argument of the constructor is filled.
Computing Morris coefficients ,
and in Uranie is dealt with the TMorris class which inherits from the TSensitivity class.
Warning
The Morris method has been designed initially to deal with uniform probability
law and uniform only. The implementation has been extended in Uranie by allowing all probability laws, but this
has to be done with caution: if one is considering to use infinite-based law it is crucial to set bounds to these.
The probability space is divided in a  hyper-grid with
  level on each dimension, and by definition, 0 and 1 are possible values that are
very likely to arise. When going back from probability space to physical one, their corresponding response should
be respectively
level on each dimension, and by definition, 0 and 1 are possible values that are
very likely to arise. When going back from probability space to physical one, their corresponding response should
be respectively  and
and  , this is why all infinite-based law should be bounded. As the chosen bounds will be very likely
to be used, their values should be chosen with care.
, this is why all infinite-based law should be bounded. As the chosen bounds will be very likely
to be used, their values should be chosen with care.
From version 4.4.0, the TMorris will quit automatically if an at least one infinite-based
law is unbounded static that:
<URANIE::ERROR>
<URANIE::ERROR> *** URANIE ERROR ***
<URANIE::ERROR> *** File[/[...]/souRCE/meTIER/sensitivity/souRCE/TMorris.cxx] Line[244]
<URANIE::ERROR>  Morris method is not meant to be run with unbounded infinite stochastic laws [kNus].
<URANIE::ERROR>  The sampling can indeed, AND WILL CERTAINLY, randomly draw a probability of 0 or 1 in the [0,1]^{nX} hypercube (see methodology).
<URANIE::ERROR>  The theoretical answer, given an unbounded infinite stochastic laws, is repectively - infinite or + infinite.
<URANIE::ERROR>  Please, if you want to use infinite stochastic laws, use the setBounds(lower,upper) method to truncate the law.
<URANIE::ERROR>  This would allow you to define the proper physical space in which your problem is defined.
<URANIE::ERROR>  !!!! WARNING !!!:
<URANIE::ERROR>   Bear in mind that the bound values will very likely be used, so choose them wisely (for a gaussian, few sigma away from the mean but not much).
<URANIE::ERROR>  !!!! WARNING !!!.
<URANIE::ERROR> *** END of URANIE ERROR ***
<URANIE::ERROR>
This class handles all the steps to compute the Morris coefficients:
- generating the sample of Morris trajectories;
- running the code or the analytic function to get the response on the sample;
- computing the values of , and
for each input
variable.
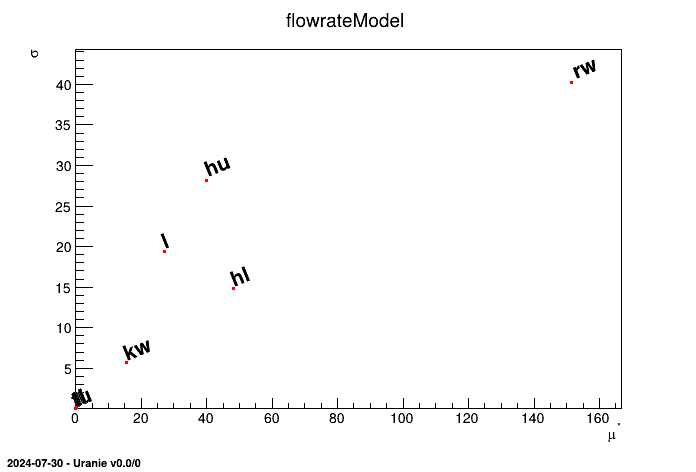
The example script below uses the TMorris class to
compute and display Morris sensitivity screening measures:
"""
Example of Morris computation
"""
from rootlogon import ROOT, DataServer, Sensitivity

ROOT.gROOT.LoadMacro("UserFunctions.C")

# Define the DataServer
tds = DataServer.TDataServer("tdsflowrate", "DataBase flowrate")
tds.addAttribute(DataServer.TUniformDistribution("rw", 0.05, 0.15))
tds.addAttribute(DataServer.TUniformDistribution("r", 100.0, 50000.0))
tds.addAttribute(DataServer.TUniformDistribution("tu", 63070.0, 115600.0))
tds.addAttribute(DataServer.TUniformDistribution("tl", 63.1, 116.0))
tds.addAttribute(DataServer.TUniformDistribution("hu", 990.0, 1110.0))
tds.addAttribute(DataServer.TUniformDistribution("hl", 700.0, 820.0))
tds.addAttribute(DataServer.TUniformDistribution("l", 1120.0, 1680.0))
tds.addAttribute(DataServer.TUniformDistribution("kw", 9855.0, 12045.0))

# Set the Morris method parameters
nreplica = 3
nlevel = 10

# Create a TMorris object
scmo = Sensitivity.TMorris(tds, "flowrateModel", nreplica, nlevel)

# generate a Morris sample
scmo.generateSample()

# Save the sample
tds.exportData("_morris_sampling_.dat")

# compute the Morris screening measures
scmo.computeIndexes()

# Display graphically the Morris screanig measures
cc = ROOT.TCanvas("can", "histogramme")
apad = ROOT.TPad("apad", "apad", 0, 0.03, 1, 1)
apad.Draw()
apad.cd()
scmo.drawIndexes("mustar", "", "nonewcanv")
Below is the figure generated by this script:
First, one defines the uncertain parameters and adds them to a TDataServer object:
# Define the DataServer
tds = DataServer.TDataServer("tdsflowrate", "DataBase flowrate")
tds.addAttribute(DataServer.TUniformDistribution("rw", 0.05, 0.15))
tds.addAttribute(DataServer.TUniformDistribution("r", 100.0, 50000.0))
tds.addAttribute(DataServer.TUniformDistribution("tu", 63070.0, 115600.0))
tds.addAttribute(DataServer.TUniformDistribution("tl", 63.1, 116.0))
tds.addAttribute(DataServer.TUniformDistribution("hu", 990.0, 1110.0))
tds.addAttribute(DataServer.TUniformDistribution("hl", 700.0, 820.0))
tds.addAttribute(DataServer.TUniformDistribution("l", 1120.0, 1680.0))
tds.addAttribute(DataServer.TUniformDistribution("kw", 9855.0, 12045.0))
There are four different constructors to build a TMorris
object, each corresponding to a different problem:
- the model is an analytic function run by Uranie,
- the model is a code run by Uranie,
- the outputs of the model are already computed and saved in a
TDataServerobject. - the model is either a function or a code and the problem is specified through a Relauncher architecture.
The constructor prototype used with an analytic function is:
# Create a TMorris object with an analytic function
TMorris(tds, fcn, nreplica, level, delta = 0, sout = "")
TMorris(tds, fcn, sinp, sout, nreplica, level, delta = 0)
This constructor takes six arguments:
- a pointer to a
TDataServerobject, - a pointer to an analytic function (either a
voidor aconst charthat represents the function's name when it has been loaded in ROOT's memory), - an integer to specify the number of trajectories the object will generate,
- an integer to specify the level of the grid which will be used
- an integer to specify the delta parameter, with
 ,
, - a
TStringto specify the names of the input variables of the model. - a
TStringto specify the names of the output variables of the model.
Here is an example of how to use the constructor with an analytic function:
nreplica = 3
nlevel = 10
scmo = Sensitivity.TMorris(tds, "flowrateModel", nreplica, nlevel)The constructor prototype used with a code is:
# Create a TMorris object with a code
TMorris(tds, fcode, nreplica, level, delta = 0)
This constructor takes five arguments:
- a pointer to a
TDataServerobject, - a pointer to a
TCode, - an integer to specify the number of trajectories the object will generate,
- an integer to specify the level of the grid which will be used
- an integer to specify the delta parameter, with ,
Here is an example using this constructor for the flowrate case:
The constructor prototype used with a runner object is:
# Create a TMorris object with a runner
TMorris(tds, run, nreplica, level, delta = 0)
This constructor takes five arguments:
- a pointer to a
TDataServerobject, - a pointer to a
TRun, - an integer to specify the number of trajectories the object will generate,
- an integer to specify the level of the grid which will be used
- an integer to specify the delta parameter, with ,
Here is an example using this constructor for the flowrate code in sequential mode:
# The input file
infile = Relauncher.TKeyScript("flowrate_input_with_keys.in")
# provide the input and their key
infile.addInput(tds.getAttribute("rw"), "Rw")
infile.addInput(tds.getAttribute("r"), "R")
infile.addInput(tds.getAttribute("tu"), "Tu")
infile.addInput(tds.getAttribute("tl"), "Tl")
infile.addInput(tds.getAttribute("hu"), "Hu")
infile.addInput(tds.getAttribute("hl"), "Hl")
infile.addInput(tds.getAttribute("l"), "L")
infile.addInput(tds.getAttribute("kw"), "Kw")

yhat = DataServer.TAttribute("yhat")
# The output file of the code
outfile = Relauncher.TKeyResult("_output_flowrate_withKey_.dat")
# The attribute in the output file
outfile.addOutput(yhat, "yhat")

# Instanciation de mon code
code = Relauncher.TCodeEval("flowrate -s -k")
# Adding the intput/output file to the code
code.addInputFile(infile)
code.addOutputFile(outfile)

run = Relauncher.TSequentialRun(code)
run.startSlave()
if run.onMaster():

    nreplicas = 3
    nlevels = 10
    scmoR = Sensitivity.TMorris(tds, run, nreplicas, nlevels)
    # ...
The two constructors before are used in the cases where the computation of the model outputs are run from
Uranie. However it is possible to compute the outputs of the model outside of Uranie then load them in a TDataServer object (via
a file) and use that TDataServer object to compute the finite differences indices.
Warning
This constructor uses a TDataServer object already filled with specific internal variables (__npoints__, __directions__ and
__morris__difference__) and a specific sample!
There are several conditions to use it:
- use the constructor without argument for the
TDataServer; - the input factors sample must have been generated with the method
TMorris::generateSample.
The constructor prototype used with a TDataServer object already containing the simulations is:
# Create a TMorris object with already filled TDS
TMorris(tds, inp, out, option = "")
This constructor takes three arguments:
- a pointer to a
TDataServerobject filled, - a string to specify the names of the input factors separated by ':' (ex. "rw:r:tu:tl:hu:hl:l:kw"),
- a string to specify the names of the output variables of the model.
Below is an example of the constructor with a TDataServer object filled:
# Define the DataServer
tds = DataServer.TDataServer()
tds.fileDataRead("_morris_launching_.dat")

scmo = Sensitivity.TMorris(tds, "rw:r:tu:tl:hu:hl:l:kw", "flowrateModel")
To generate the Morris sample, use the generateSample method:
scmo.generateSample()Then, the sample generated can be exported in a file and used outside of Uranie to compute the simulations associated.
To compute the sensitivity screening measures, use the method computeIndexes:
scmo.computeIndexes() Note that this method is all inclusive: it constructs the sample (if it does not exist), launches the simulations (if they are not already computed) and computes the indices.
To display graphically the coefficients, use the method drawIndexes.
This method shows by default the value of the measurements of versus the measurements of for all input factors of the model. To display versus the argument "mustar" should be given, as follow:
cc = ROOT.TCanvas("can", "histgramme")
scmo.drawIndexes("mustar")
The coefficients, once computed, are stored in a TTree. To get this
TTree use either the TSensitivity::getResultTuple() or the
TMorris::getResultTuple() that will provide the dedicated Morris ntuple.
ntresu = scmo.getMorrisResults()
Several methods exist in ROOT to extract data from a TTree, it is advised to look for them
into the ROOT documentation. We propose two ways of extracting the value of each coefficient from the
TTree.
The first method use the method getValue of the TMorris object specifying the
order of the extract value ("mustar", "mu" ou "sigma"), the related input and possibly more selected options.
hl_mustar_Indexe = scmo.getValue("mustar","hl");
hl_mu_Indexe = scmo.getValue("mu","hl")
hl_sigma_Indexe = scmo.getValue("sigma","hl")
The second method uses 3 steps to extract an index:
-
scan the
TTreefor the chosen input variable (with a selection) in order to obtain its row number. In our example, if we chose the variable "hl", we'll use the command:
and in the resulting figure below we see that the measurentresu.Scan("*", "Input==\"hl\"") of "hl" is in the row 5:
************************************************************************
*    Row   *     Input *    Output *     mu.mu * mustar.mu * sigma.sig *
************************************************************************
*        5 *        hl * flowrateM * -48.15217 * 48.152173 * 14.855638 *
************************************************************************
-
set the entry of the
TTreeon this row with the methodGetEntry; -
get the value of the index with
GetValuemethod on the "mu" leaf of theTTree.
Below is an example of extraction of the index for hl in our flowrate case:
ntresu.Scan("*", "Input==\"hl\"")
ntresu.GetEntry(5)
Hl_mu_Indexe = ntresu.GetLeaf("mu").GetValue() The third method uses 2 steps to extract an index:
-
use the
Drawmethod with a selection to select the index, for example the selection for the measure of
"rw" is "Input==\"rw\"";
-
get the pointer on the value of the index with
GetV1method on theTTree.
Below is another example of extraction of the index for "rw" in our flowrate case:
ntresu.Draw("mustar", "Input==\"rw\"", "goff")
Rw_mustar_Indexe = ntresu.GetV1()[0]
Summary: TMorris constructor
TMorris(TDataServer*tds, const char *fcn, Int_t nreplica, Int_t level, Double_t delta=0,TStringsout="")- tds: an empty dataserver containing the input variables.
- fcn: the function to analyse (the function's name).
- nreplica: an integer specifying the number of trajectories which will be generated.
- level: an integer specifying the number of intervals in each dimension for the grid.
- delta: an integer value to specify the delta parameter, with .
- sout: attribute names which represent the responses of the model.
TMorris(TDataServer*tds, void *f(double *,double *),TStringsin,TStringsout, Int_t nreplica, Int_t level, Double_t delta=0,TStringsout="")- tds: an empty dataserver containing the input variables.
- f: the function to analyse (a pointer).
- sin: attribute names which represent the inputs of the model.
- sout: attribute names which represent the responses of the model.
- nreplica: an integer specifying the number of trajectories which will be generated.
- level: an integer specifying the number of intervals in each dimension for the grid.
- delta: an integer value to specify the delta parameter, with .
TMorris(TDataServer*tds, const char *inp, const char *out, Option_t *option="")- tds: a dataserver containing the input and output attributes and their associated data.
- inp: input attribute names separated by colons. They represent all the inputs of the problem. They must refer to existing attributes in the "tds".
- out: attribute names which represent the response of the problem. it must refer to existing attributes in the "tds".
- option: no option has been implemented.
TMorris(TDataServer*tds,TCode*fcode, Int_t nreplica, Int_t level, Double_t delta=0)- tds: an empty dataserver containing the input variables.
- fcode: the code to analyse .
- nreplica: an integer specifying the number of trajectories which will be generated.
- level: an integer specifying the number of intervals in each dimension for the grid.
- delta: an integer value to specify the delta parameter, with .
TMorris(TDataServer*tds,TRun*run Int_t nreplica, Int_t level, Double_t delta=0)- tds: an empty dataserver containing the input variables.
- run: The runner to be used that contains the code and the way to distribute.
- nreplica: an integer specifying the number of trajectories which will be generated.
- level: an integer specifying the number of intervals in each dimension for the grid.
- delta: an integer value to specify the delta parameter, with .
| |  | |
| VI.3. The regression method |  | VI.5. The Sobol method |