13.5.1. Macro “sensitivityBrutForceMethodFlowrate.C”
13.5.1.1. Objective
The objective of this macro is to perform a sensitivity analysis with brute force method on a set of eight parameters used in the flowrate model described in Presentation of the problem. Sensitivity indexes are computed dividing conditional variance by the standard deviation of the output variable.
Warning
This macro is purely illustrative. It is not meant to be used for proper results with a real code / function as it needs a large number of computation to only get the first order index. Its main appeal is to be nicely illustrative: it shows plainly the definition of the conditional expectation and also its variance used to defined the first order sobol indices.
13.5.1.2. Macro Uranie
void drawBarWithTuple(TTree *tt, TString sx, TString sy, TString stitle)
{
    TLeaf *lx = tt->GetLeaf(sx);
    TLeaf *ly = tt->GetLeaf(sy);

    TH1F *hDiv = new TH1F("hDivdrawBarWithTuple",stitle,3,0,3);
    hDiv->SetCanExtend(TH1::kXaxis); //SetBit(TH1::kCanRebin);
    hDiv->SetStats(0);

    if ( hDiv ) {
        hDiv->SetBarWidth(0.45);
        hDiv->SetBarOffset(0.1);
        hDiv->SetMarkerColor(2);
        hDiv->SetMarkerSize(2);
        hDiv->SetFillColor(49);
        hDiv->SetTitle(stitle);
        for (Int_t i = 0; i < tt->GetEntries(); i++) {
            tt->GetEntry(i);
            TString title = *((string*)lx->GetValuePointer());
            hDiv->Fill(title, ly->GetValue());
        }
        hDiv->LabelsDeflate();
        hDiv->LabelsOption(">u");
        hDiv->SetMinimum(0.0);
        hDiv->SetMaximum(1.0);
        gStyle->SetPaintTextFormat("5.2f");
        hDiv->Draw("bar2, text45");
    }
}

void sensitivityBrutForceMethodFlowrate(Int_t nCond = 50, Int_t nbins = 10,
    const string& figure="figure.png", const string& style="", const string& filename="")
{
    // Create a TDataServer
    TDataServer * tds = new TDataServer();

    cout << endl << " ******************************************************" << endl;
    cout << " ** sensitivityBrutForceMethodFlowrate nbins[" << nbins << "] nCond[" << nCond << "]" << endl;
    cout << " **" << endl;

    // Add the eight attributes of the study with uniform law
    tds->addAttribute( new TUniformDistribution("rw", 0.05, 0.15));
    tds->addAttribute( new TUniformDistribution("r", 100.0, 50000.0));
    tds->addAttribute( new TUniformDistribution("tu", 63070.0, 115600.0));
    tds->addAttribute( new TUniformDistribution("tl", 63.1, 116.0));
    tds->addAttribute( new TUniformDistribution("hu", 990.0, 1110.0));
    tds->addAttribute( new TUniformDistribution("hl", 700.0, 820.0));
    tds->addAttribute( new TUniformDistribution("l", 1120.0, 1680.0));
    tds->addAttribute( new TUniformDistribution("kw", 9855.0, 12045.0));

    Int_t nvar = tds->getNAttributes();
    cout << " ** nX[" << nvar << "]" << endl;

    Int_t nS = nbins*nvar*nCond;
    cout << " ** nS[" << nS << "]" << endl;

    // TSampling *sam = new TSampling(tds, "lhs", nS);
    TQMC * sam = new TQMC(tds, "halton", nS);
    sam->generateSample();

    // Load the function
    gROOT->LoadMacro("UserFunctions.C");

    // Create a TLauncherFunction from a TDataServer and an analytical function
    // Rename the outpout attribute "ymod"
    TLauncherFunction * tlf = new TLauncherFunction(tds, "flowrateModel","","ymod");
    // Evaluate the function on all the design of experiments
    tlf->setDrawProgressBar(kFALSE);
    tlf->run();

    TCanvas *Canvas = new TCanvas("c1", "Graph for the Macro modeler",5,64,1270,667);
    TPad *pad = new TPad("pad","pad",0, 0.03, 1, 1); pad->Draw();
    pad->Divide(2,2);
    pad->cd(1);
    tds->computeStatistic("ymod");
    tds->draw("ymod");
    Double_t dstdy = tds->getAttribute("ymod")->getStd();
    Double_t svary = dstdy * dstdy;
    cout << " ** ymod : std[" << dstdy << "] vary[" << svary  << "]" << endl;

    tds->getAttribute("ymod")->setOutput();

    gStyle->SetOptStat(1);

    // Tempory TTree for Histogram visualisation
    Double_t valSobolCrt;
    string   sName;
    TTree *tt = new TTree("sobolforcebrut","MonteCarlo brute force sobol sensitivity ");
    tt->Branch("Var","string",&sName);
    tt->Branch("Value",&valSobolCrt,"Value/D");
    tt->SetMarkerColor(kRed);
    tt->SetMarkerStyle(7);
    tt->SetMarkerSize(1.75);

    TCanvas *c = new TCanvas();
    c->Divide(2);
    c->cd(1);
    for(Int_t ivar=0; ivar<nvar; ivar++) {
        cout << " *****************************" << endl << " *** " <<  tds->getAttribute(ivar)->GetName() << endl;

        const char * svar = tds->getAttribute(ivar)->GetName();

        if(ivar==0)
            pad->cd(2);
        else
            c->cd(1);

        tds->drawProfile(Form("ymod:%s", svar),"",Form("nclass=%d", nbins));
        TProfile *hprofs = (TProfile*)gPad->GetPrimitive(Form("Profile ymod:%s (Bin = %d )", svar, nbins+2));

        TNtupleD * ntd = new TNtupleD("dd", "sjsjs", "i:x:m");
        ntd->SetMarkerColor(kBlue);
        ntd->SetMarkerStyle(8);
        //    ntd->SetMarkerSize(1.25);
        Int_t nnbins = hprofs->GetNbinsX();
        for(Int_t i=1; i <= nnbins; i++)
            ntd->Fill(i-1, hprofs->GetBinCenter(i), hprofs->GetBinContent(i));

        tds->draw(Form("ymod:%s", svar));
        ntd->Draw("m:x", "","same");

        if(ivar==0)
            pad->cd(3);
        else
            c->cd(2);

        ntd->Draw("m");
        TH1F *htemp = (TH1F*)gPad->GetPrimitive("htemp");

        Double_t dvarcond = htemp->GetRMS();

        // Tempory TTree for histogram
        sName=string(svar);
        valSobolCrt = dvarcond*dvarcond /svary;
        tt->Fill();
        cout << " *** S1[ " << svar <<"] Cond. Var.[" << dvarcond*dvarcond << "] -- [" << valSobolCrt <<"]" << endl;

        c->Modified(); c->Update(); c->SaveAs(Form("SAFlowRateVersus%s.png", svar));

        delete ntd;
    }
    pad->cd(4);
    drawBarWithTuple(tt, "Var", "Value", "Sensitivity Indexes : ymod  [ Brute-Force Method ]");
}
Each parameter is related to the TDataServer as a TAttribute and obeys an uniform law on specific interval:
    TDataServer * tds = new TDataServer();
    tds->addAttribute( new TUniformDistribution("rw", 0.05, 0.15));
    tds->addAttribute( new TUniformDistribution("r", 100.0, 50000.0));
    tds->addAttribute( new TUniformDistribution("tu", 63070.0, 115600.0));
    tds->addAttribute( new TUniformDistribution("tl", 63.1, 116.0));
    tds->addAttribute( new TUniformDistribution("hu", 990.0, 1110.0));
    tds->addAttribute( new TUniformDistribution("hl", 700.0, 820.0));
    tds->addAttribute( new TUniformDistribution("l", 1120.0, 1680.0));
    tds->addAttribute( new TUniformDistribution("kw", 9855.0, 12045.0));
A design-of-experiments is built with a “Halton” method (\(n_S\) = 4000):
    TQMC * sam = new TQMC(tds, "halton", nS);
    sam->generateSample();
The function flowrateModel is loaded from the macro UserFunctions.C (the file can be found in
${URANIESYS}/share/uranie/macros):
gROOT->LoadMacro("UserFunctions.C");
The flowrateModel model is applied on previous variables:
    TLauncherFunction * tlf = new TLauncherFunction(tds, "flowrateModel","","ymod");
    tlf->run();
Characteristic values for the output attribute are computed:
tds->computeStatistic("ymod");
Sensitivity indexes are computed in the for loop. Average value of output variable is computed on nbins+2=12 points for each input variable:
c->cd(1);
...
Int_t nnbins = hprofs->GetNbinsX();
for(Int_t i=1; i <= nnbins; i++)
    ntd->Fill(i-1, hprofs->GetBinCenter(i), hprofs->GetBinContent(i));
The RMS value is obtained from the graphic of ymod versus the considered output variable and the sensitivity index is computed dividing the conditional variance value by the standard deviation of the output variable ymod.
        c->cd(2);

    ntd->Draw("m");
    TH1F *htemp = (TH1F*)gPad->GetPrimitive("htemp");

    Double_t dvarcond = htemp->GetRMS();
    valSobolCrt = dvarcond*dvarcond /svary;
13.5.1.3. Graph
Figure 13.18 Graph of the macro “sensitivityBrutForceMethodFlowrate.C”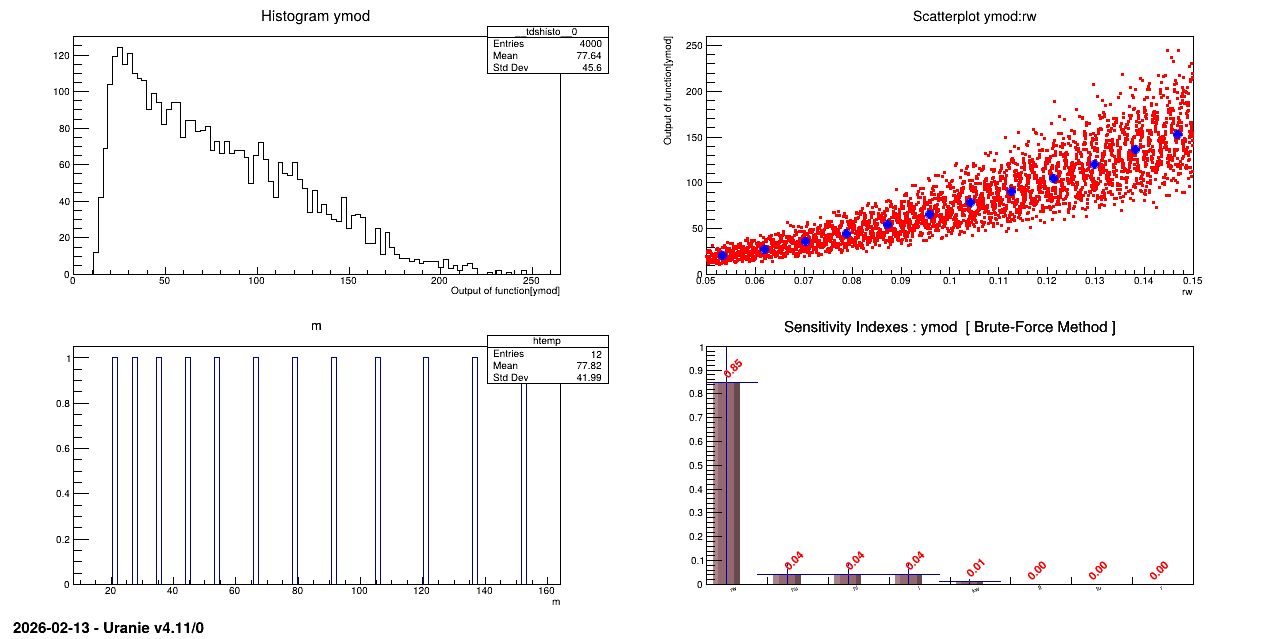
13.5.1.4. Console
--- Uranie v4.11/0 --- Developed with ROOT (6.36.06)
                      Copyright (C) 2013-2026 CEA/DES
                      Contact: support-uranie@cea.fr
                      Date: Thu Feb 12, 2026


 ******************************************************
 ** sensitivityBrutForceMethodFlowrate nbins[10] nCond[50]
 **
 ** nX[8]
 ** nS[4000]
 ** ymod : std[45.6059] vary[2079.9]
 *****************************
 *** rw
 *** S1[ rw] Cond. Var.[1763.28] -- [0.847774]
Info in <TCanvas::Print>: png file SAFlowRateVersusrw.png has been created
 *****************************
 *** r
 *** S1[ r] Cond. Var.[0.0624988] -- [3.00489e-05]
Info in <TCanvas::Print>: png file SAFlowRateVersusr.png has been created
 *****************************
 *** tu
 *** S1[ tu] Cond. Var.[0.0886501] -- [4.26223e-05]
Info in <TCanvas::Print>: png file SAFlowRateVersustu.png has been created
 *****************************
 *** tl
 *** S1[ tl] Cond. Var.[0.0909604] -- [4.37331e-05]
Info in <TCanvas::Print>: png file SAFlowRateVersustl.png has been created
 *****************************
 *** hu
 *** S1[ hu] Cond. Var.[88.368] -- [0.0424867]
Info in <TCanvas::Print>: png file SAFlowRateVersushu.png has been created
 *****************************
 *** hl
 *** S1[ hl] Cond. Var.[88.2039] -- [0.0424078]
Info in <TCanvas::Print>: png file SAFlowRateVersushl.png has been created
 *****************************
 *** l
 *** S1[ l] Cond. Var.[84.9543] -- [0.0408454]
Info in <TCanvas::Print>: png file SAFlowRateVersusl.png has been created
 *****************************
 *** kw
 *** S1[ kw] Cond. Var.[20.8848] -- [0.0100413]
Info in <TCanvas::Print>: png file SAFlowRateVersuskw.png has been created