13.5.12. Macro “sensitivitySobolLeveLE.C”
Warning
The levele command will be installed on your machine only if a Fortran compiler is found
13.5.12.1. Objective
The objective of this macro is to perform a full Sobol analysis on the temporal use-case levele.
This use-case is an example of code that takes a dozen of entries in order to compute the evolution
of dose as a function of time. The result of every computation consists in 3 vectors: the time (always
the same value disregarding all entries), the dose called “y” and a third useless information.
13.5.12.2. Macro Uranie
    // Define the DataServer
    TDataServer *tds = new TDataServer("tdsLevelE","levele");

    tds->addAttribute( new TUniformDistribution("t", 100, 1000) );
    tds->addAttribute( new TLogUniformDistribution("kl", 0.001, 0.01) );
    tds->addAttribute( new TLogUniformDistribution("kc", 0.000001, 0.00001) );
    tds->addAttribute( new TLogUniformDistribution("v1", 0.001, 0.1) );
    tds->addAttribute( new TUniformDistribution("l1", 100, 500) );
    tds->addAttribute( new TUniformDistribution("r1", 1, 5) );
    tds->addAttribute( new TUniformDistribution("rc1", 3, 30) );
    tds->addAttribute( new TLogUniformDistribution("v2", 0.01, 0.1) );
    tds->addAttribute( new TUniformDistribution("l2", 50, 200) );
    tds->addAttribute( new TUniformDistribution("r2", 1, 5) );
    tds->addAttribute( new TUniformDistribution("rc2", 3, 30) );
    tds->addAttribute( new TLogUniformDistribution("w", 100000, 10000000) );

    //Tell the code where to find attribute value in input file
    TString sIn="levelE_input_with_values_rows.in";
    tds->getAttribute("t")->setFileKey(sIn, "", "%e", TAttributeFileKey::kNewRow);
    tds->getAttribute("kl")->setFileKey(sIn, "", "%e", TAttributeFileKey::kNewRow);
    tds->getAttribute("kc")->setFileKey(sIn, "", "%e", TAttributeFileKey::kNewRow);
    tds->getAttribute("v1")->setFileKey(sIn, "", "%e", TAttributeFileKey::kNewRow);
    tds->getAttribute("l1")->setFileKey(sIn, "", "%e", TAttributeFileKey::kNewRow);
    tds->getAttribute("r1")->setFileKey(sIn, "", "%e", TAttributeFileKey::kNewRow);
    tds->getAttribute("rc1")->setFileKey(sIn, "", "%e", TAttributeFileKey::kNewRow);
    tds->getAttribute("v2")->setFileKey(sIn, "", "%e", TAttributeFileKey::kNewRow);
    tds->getAttribute("l2")->setFileKey(sIn, "", "%e", TAttributeFileKey::kNewRow);
    tds->getAttribute("r2")->setFileKey(sIn, "", "%e", TAttributeFileKey::kNewRow);
    tds->getAttribute("rc2")->setFileKey(sIn, "", "%e", TAttributeFileKey::kNewRow);
    tds->getAttribute("w")->setFileKey(sIn, "", "%e", TAttributeFileKey::kNewRow);

    //How to read ouput files
    TOutputFileRow *out = new TOutputFileRow("_output_levelE_withRow_.dat");
    //Tell the output file that attribute IS a vector and is SECOND column
    out->addAttribute(new TAttribute("y", TAttribute::kVector), 2 );

    //Creation of TCode
    TCode *myc = new TCode(tds,"levele 2> /dev/null");
    myc->addOutputFile(out);

    //Run Sobol analysis
    TSobol * tsobol = new TSobol(tds, myc, 10000);
    tsobol->computeIndexes(computeIdxOpt.data()); // computeIdxOpt = "" or "nointermed"

    TTree *ntresu = (TTree*)tsobol->getResultTuple();

    //Plotting mess
    int colors[12] ={1,2,3,4,6,7,8,15,30,38,41,46};
    double tps[26]={20000,30000,40000,50000,60000,70000,80000,90000,100000, 200000,300000,400000,500000,600000,700000,800000,900000, 1e+06,2e+06,3e+06,4e+06,5e+06,6e+06,7e+06,8e+06,9e+06};

    TCanvas *c2 = new TCanvas("c2","c2",5,64,1200,900);
    TPad *pad = new TPad("pad","pad",0, 0.03, 1, 1); pad->Draw();
    pad->Divide(1,2); pad->cd(1); gPad->SetLogx();  gPad->SetGrid();

    //LegendandMArker
    gStyle->SetMarkerStyle(3);
    gStyle->SetLegendBorderSize(0);
    gStyle->SetFillStyle(0);

    TMultiGraph *mg2 = new TMultiGraph();
    string names[12] = {"t","kl","kc","v1","l1","r1","rc1","v2","l2","r2","rc2","w"};
    TGraphAsymmErrors *fdeg[12];
    TLegend *leg[6]; double *data, *themin, *themax;

    for(unsigned int igr=0; igr<12; igr++)
    {
        stringstream sel; sel << "Inp==\"" << names[igr] << "\" && Order==\"First\" &&  Algo==\"martinez11\"";
        ntresu->Draw("CILower:CIUpper:Value", sel.str().c_str(),"goff");
        data=ntresu->GetV3();
        themin=ntresu->GetV1();
        themax=ntresu->GetV2();
        for(unsigned int i=0; i<26; i++)
        {
            themin[i] = data[i] - themin[i];
            themax[i] = - data[i] + themax[i];
        }

        if(igr%2==0)
        {
            leg[igr/2] = new TLegend(0.1+0.15*(igr/2),0.91,0.25+0.15*(igr/2),0.98);
            leg[igr/2]->SetTextSize(0.045);
        }

        fdeg[igr] = new TGraphAsymmErrors(26,tps, data,0, 0, themin, themax);
        fdeg[igr]->SetMarkerColor(colors[igr]); fdeg[igr]->SetLineColor(colors[igr]);  fdeg[igr]->SetFillColor(colors[igr]);
        leg[igr/2]->AddEntry(fdeg[igr],names[igr].c_str(),"pl");
    }

    for(int igr2=11; igr2>-1; igr2--)
        mg2->Add(fdeg[igr2]);

    mg2->Draw("APC");
    mg2->GetXaxis()->SetTitle("Time");
    mg2->GetYaxis()->SetTitle("S_{1}[martinez11]");
    for( int igr3=0; igr3<6; igr3++ )
        leg[igr3]->Draw();


    TMultiGraph *mg = new TMultiGraph();
    TGraphAsymmErrors *tdeg[12];
    pad->cd(2); gPad->SetLogx(); gPad->SetGrid();
    for(unsigned int igr=0; igr<12; igr++)
    {
        stringstream sel; sel << "Inp==\"" << names[igr] << "\" && Order==\"Total\" &&  Algo==\"martinez11\"";
        ntresu->Draw("CILower:CIUpper:Value", sel.str().c_str(),"goff");
        data=ntresu->GetV3();
        themin=ntresu->GetV1();
        themax=ntresu->GetV2();
        for(unsigned int i=0; i<26; i++)
        {
            themin[i] = data[i] - themin[i];
            themax[i] = - data[i] + themax[i];
        }


        for(unsigned int ip=0; ip<26; ip++)
        {
            if(ip==0)
            {
                tdeg[igr] = new TGraphAsymmErrors();
                tdeg[igr]->SetMarkerColor(colors[igr]); tdeg[igr]->SetLineColor(colors[igr]);  tdeg[igr]->SetFillColor(colors[igr]);
            }

            tdeg[igr]->SetPoint(ip, tps[ip], data[ip]);
            tdeg[igr]->SetPointError(ip, 0, 0, themin[ip], themax[ip]);
        }
    }

    for(int igr2=11; igr2>-1; igr2--)
        mg->Add(tdeg[igr2]);

    mg->Draw("APC");
    mg->GetXaxis()->SetTitle("Time");
    mg->GetYaxis()->SetTitle("S_{T}[martinez11]");
    for( int igr3=0; igr3<6; igr3++ )
        leg[igr3]->Draw();
The levele external code is located in the bin directory of the Uranie installation.
When looking at the code and comparing it to an usual Sobol estimation, the organisation is completely transparent. The only noticeable (and compulsory) thing to do is to change the default type of the attribute read at the end of the job. This is done in this line:
out->addAttribute(new TAttribute("y", TAttribute::kVector), 2 );
where the output attribute is provided, changing its nature to a vector, thanks to the second argument
of the TAttribute constructor from the default (kReal) to the desired nature (kVector). Once
this is done, this information is broadcast internally to the code that knows how to deal with this
type of attribute.
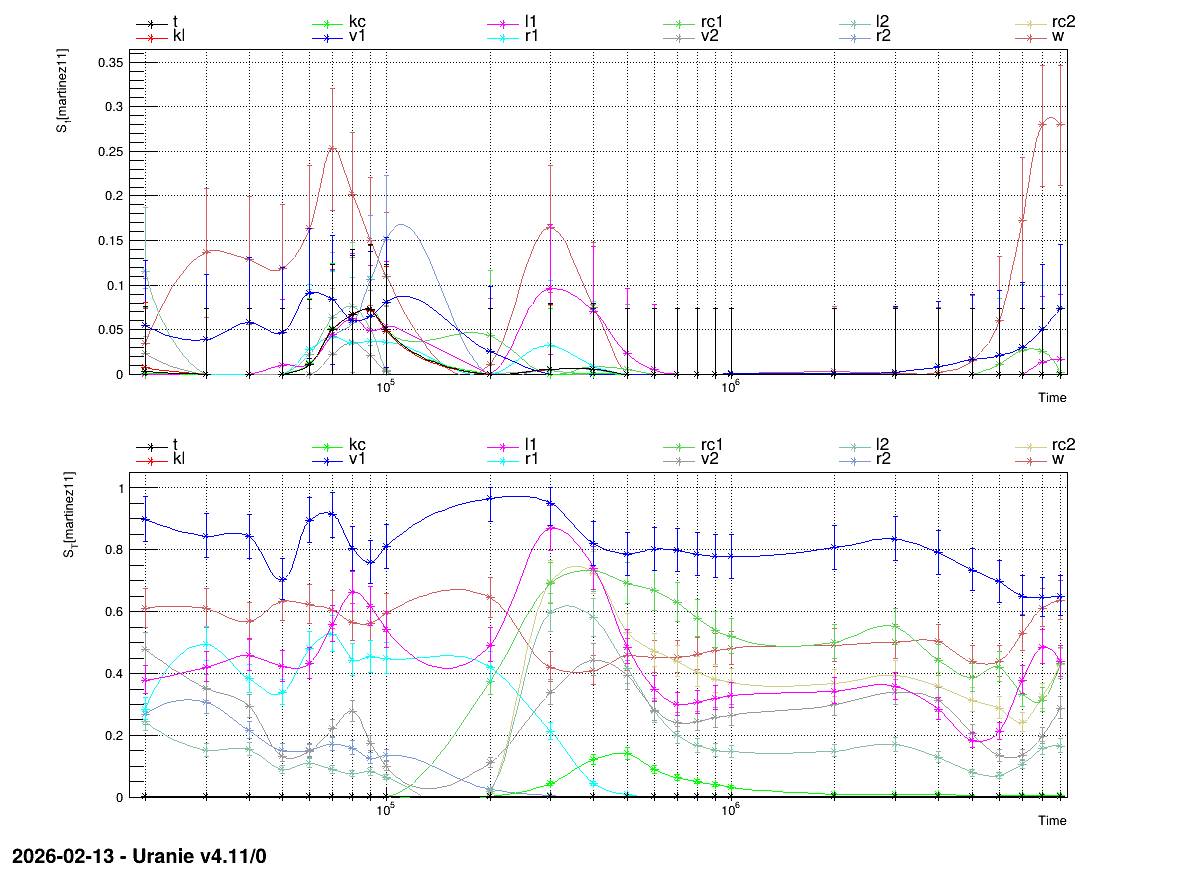
The rest of the code is the graphical part, leading to the figure below (it is provided to illustrate how to represent results).
13.5.12.3. Graph
The results of the previous macro is shown in Figure 13.28, where the evolution of the sobol coefficient is shown for all inputs with the uncertainty band, for the first order coefficient and the total one, respectively on the top and bottom panel.
Figure 13.28 Graph of the macro “sensitivitySobolLeveLE.C”