13.5.6. Macro “sensitivityMorrisFunctionFlowrate.C”
13.5.6.1. Objective
The objective of this macro is to perform a Morris sensitivity analysis on a set of eight parameters
used in the flowrateModel model described in Presentation of the problem.
13.5.6.2. Macro Uranie
void sensitivityMorrisFunctionFlowrate(Int_t nk = 5, const string& figure="figure.png", const string& style="",
    const string& filename="", const string& treename="", int seed=0)
{
    gROOT->LoadMacro("UserFunctions.C");

    // Define the DataServer
    TDataServer *tds = new TDataServer("tdsflowreate", "DataBase flowreate");
    tds->addAttribute( new TUniformDistribution("rw", 0.05, 0.15));
    tds->addAttribute( new TUniformDistribution("r", 100.0, 50000.0));
    tds->addAttribute( new TUniformDistribution("tu", 63070.0, 115600.0));
    tds->addAttribute( new TUniformDistribution("tl", 63.1, 116.0));
    tds->addAttribute( new TUniformDistribution("hu", 990.0, 1110.0));
    tds->addAttribute( new TUniformDistribution("hl", 700.0, 820.0));
    tds->addAttribute( new TUniformDistribution("l", 1120.0, 1680.0));
    tds->addAttribute( new TUniformDistribution("kw", 9855.0, 12045.0));

    Int_t nreplique = 3;
    Int_t nlevel = 10;
    TMorris * scmo = new TMorris(tds, "flowrateModel", nreplique, nlevel);
    scmo->setDrawProgressBar(kFALSE);
    scmo->generateSample();

    tds->exportData("_morris_sampling_.dat");
    scmo->computeIndexes();

    tds->exportData("_morris_launching_.dat");

    TTree *ntresu = scmo->getMorrisResults();
    ntresu->Scan("*");

    // Graph
    TCanvas  *cc = new TCanvas("c1", "Graph for the Macro sensitivityMorrisFunctionFlowrate",5,64,1270,667);
    TPad *pad = new TPad("pad","pad",0, 0.03, 1, 1); pad->Draw();
    pad->Divide(2);
    pad->cd(1);
    scmo->drawSample("", -1,"nonewcanv");
    pad->cd(2);
    scmo->drawIndexes("mustar,nonewcanv");
}
The function flowrateModel is loaded from the macro UserFunctions.C (the file can be found in
${URANIESYS}/share/uranie/macros)
gROOT->LoadMacro("UserFunctions.C");
Each parameter is related to the TDataServer as a TAttribute and obeys an uniform law on specific interval:
    TDataServer *tds = new TDataServer("tdsflowreate", "DataBase flowreate");
    tds->addAttribute( new TUniformDistribution("rw", 0.05, 0.15));
    tds->addAttribute( new TUniformDistribution("r", 100.0, 50000.0));
    tds->addAttribute( new TUniformDistribution("tu", 63070.0, 115600.0));
    tds->addAttribute( new TUniformDistribution("tl", 63.1, 116.0));
    tds->addAttribute( new TUniformDistribution("hu", 990.0, 1110.0));
    tds->addAttribute( new TUniformDistribution("hl", 700.0, 820.0));
    tds->addAttribute( new TUniformDistribution("l", 1120.0, 1680.0));
    tds->addAttribute( new TUniformDistribution("kw", 9855.0, 12045.0));
To instantiate the TMorris, one uses the TDataServer, the name of the function, the number of replicas
(here nreplique=3), the level parameter (here nlevel=10)
TMorris * scmo = new TMorris(tds, "flowrateModel", nreplique, nlevel);
Creation of the sampling:
scmo->generateSample();
Data are exported in an ASCII file:
tds->exportData("_morris_sampling_.dat");
Computation of sensitivity indexes:
scmo->computeIndexes();
13.5.6.3. Graph
Figure 13.22 Graph of the macro “sensitivityMorrisFunctionFlowrate.C”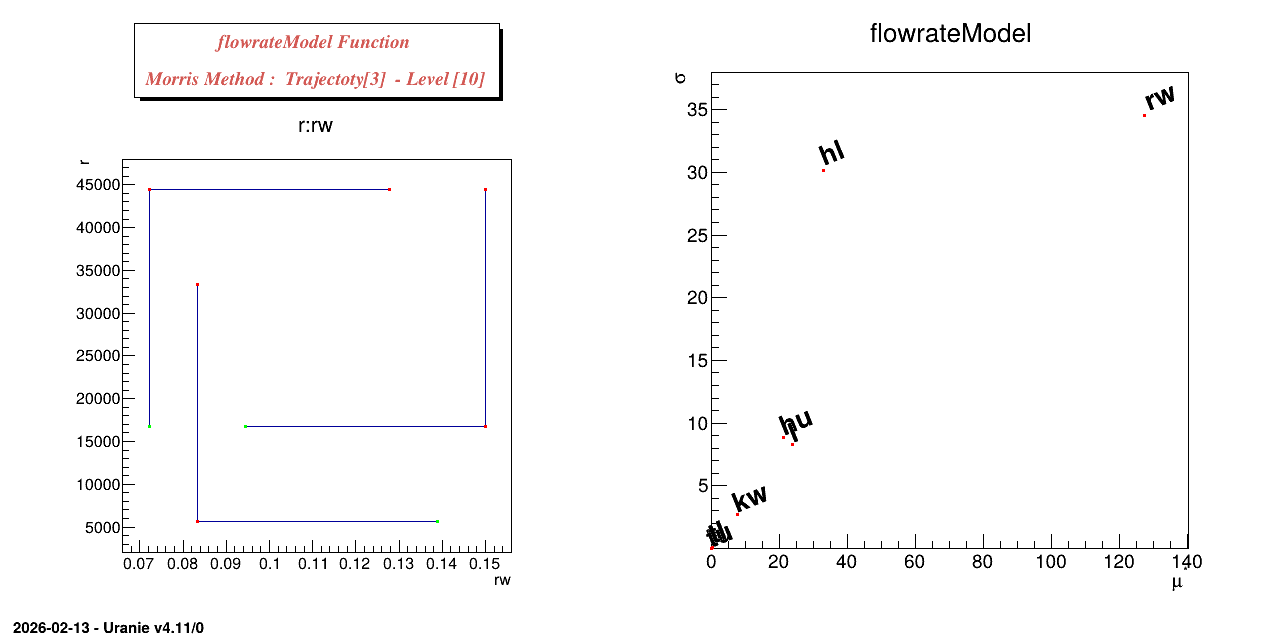
13.5.6.4. Console
************************************************************************
*    Row   *     Input *    Output *     mu.mu * mustar.mu * sigma.sig *
************************************************************************
*        0 *        rw * flowrateM * 127.47900 * 127.47900 * 34.521839 *
*        1 *         r * flowrateM * -0.069601 * 0.0696013 * 0.0793689 *
*        2 *        tu * flowrateM * 0.0004201 * 0.0004201 * 0.0004641 *
*        3 *        tl * flowrateM * 0.4659763 * 0.4659763 * 0.3301256 *
*        4 *        hu * flowrateM * 21.192361 * 21.192361 * 8.8498989 *
*        5 *        hl * flowrateM * -32.74887 * 32.748874 * 30.146134 *
*        6 *         l * flowrateM * -23.89328 * 23.893280 * 8.2781934 *
*        7 *        kw * flowrateM * 7.5766167 * 7.5766167 * 2.7457665 *
************************************************************************