13.5.14. Macro “sensitivitySobolWithData.C”
13.5.14.1. Objective
The objective of this macro is to perform a Sobol analysis using the some already made computations in order to be able to save ressources. The idea (discussed in the second item in the tip box in Computation of Sobol’s sensitivity indices is indeed to use the provided points as the \(2 \times n_S\) first estimations corresponding to both the \(M\) and \(N\) matrices content. The class will still have to create all the cross configurations (the \(N_i\) matrices) and launch their corresponding estimations. In order to do that there are few things to keep in mind:
The input file (here
_onlyMandN_sobol_launching_.dat) should contains input and output variables only, the user being in charge of having a decent design-of-experiments for the sobol estimation.
Warning
The _onlyMandN_sobol_launching_.dat file used as input is not provided in the usual sub-directory
“/share/uranie/macros” of the installation folder of Uranie ($URANIESYS) but can be generated
by the user by running the macro discussed in Macro “sensitivitySobolFunctionFlowrate.C”.
13.5.14.2. Macro Uranie
    // Define the DataServer
    TDataServer *tds = new TDataServer("tdsflowreate", "DataBase flowreate");

    gROOT->LoadMacro("UserFunctions.C");

    tds->fileDataRead("_onlyMandN_sobol_launching_.dat");

    int ns=10000;
    TSobol * tsobol = new TSobol(tds, "flowrateModel", ns, "rw:r:tu:tl:hu:hl:l:kw", "flowrateModel", "WithData");
    tsobol->setDrawProgressBar(kFALSE);
    tsobol->computeIndexes();

    TCanvas *cc = new TCanvas("c1", "histgramme",5,64,1270,667);
    TPad *pad = new TPad("pad","pad",0, 0.03, 1, 1); pad->Draw();
    pad->Divide(2,1);
    pad->cd(1);
    tsobol->drawIndexes("Flowrate", "", "nonewcanv,hist,all");

    pad->cd(2);
    tsobol->drawIndexes("Flowrate", "", "nonewcanv,pie,first");
As for Macro “sensitivitySobolFunctionFlowrate.C”, the UserFunctions.C file is loaded and the input file
_onlyMandN_sobol_launching_.dat (which should have been generated by the use of
sensitivtySobolFunctionFlowrate.C), is loaded into the dataserver. The TSobol object is constructed from the
usual function constructor with a noticing difference: the option field is filled with WithData to
specify that data are already there and the code has to use these data and split them into both the
\(M\) and \(N\) matrices.
TSobol * tsobol = new TSobol(tds, "flowrateModel", ns, "rw:r:tu:tl:hu:hl:l:kw", "flowrateModel", "WithData");
Once done, the computeIndexes() method is called and few lines are shown to display the results in
the classical plot form, leading to the figure below (it is provided to illustrate how to represent
results). The numerical results are shown in the console below and are identical to the ones shown
in Console from where the original set of points is coming from.
13.5.14.3. Graph
The results of the previous macro is shown in Figure 13.30, where the evolution of the sobol coefficient is shown for all inputs with the uncertainty band, for the first order coefficient and the total one, respectively on the top and bottom panel.
Figure 13.30 Graph of the macro “sensitivitySobolWithData.C”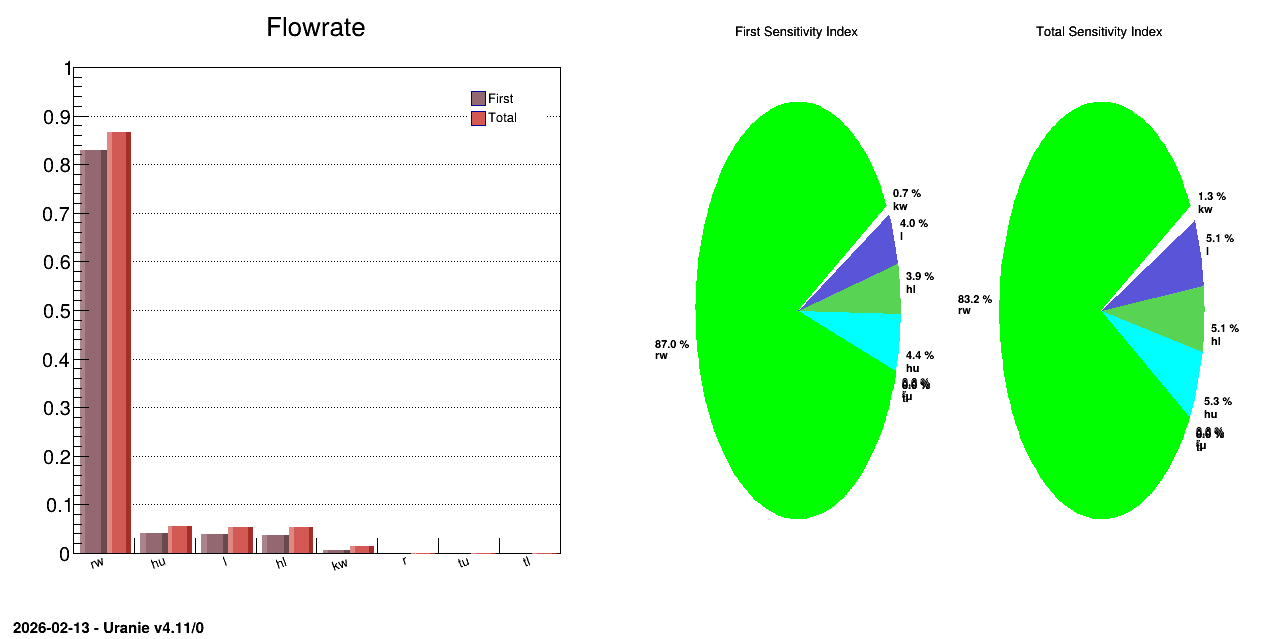
13.5.14.4. Console
--- Uranie v4.11/0 --- Developed with ROOT (6.36.06)
                      Copyright (C) 2013-2026 CEA/DES
                      Contact: support-uranie@cea.fr
                      Date: Thu Feb 12, 2026

 ** Case of Output atty [flowrateModel]  nSimPerIndex 10000
 ** Input att [rw] First [0.830033] Total Order[0.865762]
 ** Input att [r] First [0] Total Order[0.000102212]
 ** Input att [tu] First [0] Total Order[0.0001]
 ** Input att [tl] First [0] Total Order[0.000110756]
 ** Input att [hu] First [0.0417298] Total Order[0.0554922]
 ** Input att [hl] First [0.0367345] Total Order[0.0526188]
 ** Input att [l] First [0.0384214] Total Order[0.0535728]
 ** Input att [kw] First [0.00669831] Total Order[0.0132316]