

Documentation
/ Guide méthodologique
: 
| V.4. The Morris screening method | ||
|---|---|---|
 | Chapter V. Sensitivity analysis |  |
The Morris method [Morris95] is an effective screening procedure
that robustifies a bit the OAT protocol (One-factor-At-a-Time). Instead of varying every input parameters only
once (leading then to a minimum of  assessments of the code/function, with an OAT technique), the Morris method repeats this OAT
principle
assessments of the code/function, with an OAT technique), the Morris method repeats this OAT
principle  times (practically, it is between 5 and 10 times, each time being called a trajectory
or a replica), with a randomly chosen starting point (in the input parameters space). In order
to do so, it computes Elementary effects (later on called EE), defined as where
times (practically, it is between 5 and 10 times, each time being called a trajectory
or a replica), with a randomly chosen starting point (in the input parameters space). In order
to do so, it computes Elementary effects (later on called EE), defined as where  is the chosen variation in the trajectory
  . This variation can be set by the user, but the default (recommended, because it is
supposed to be optimal [Salt04]) value is
. This variation can be set by the user, but the default (recommended, because it is
supposed to be optimal [Salt04]) value is 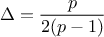 , knowing the evolution range of the considered input
and the chosen level
, knowing the evolution range of the considered input
and the chosen level  that
describes in how many interval, the range should be split. The resulting cost (in terms of assessment number)
is then
that
describes in how many interval, the range should be split. The resulting cost (in terms of assessment number)
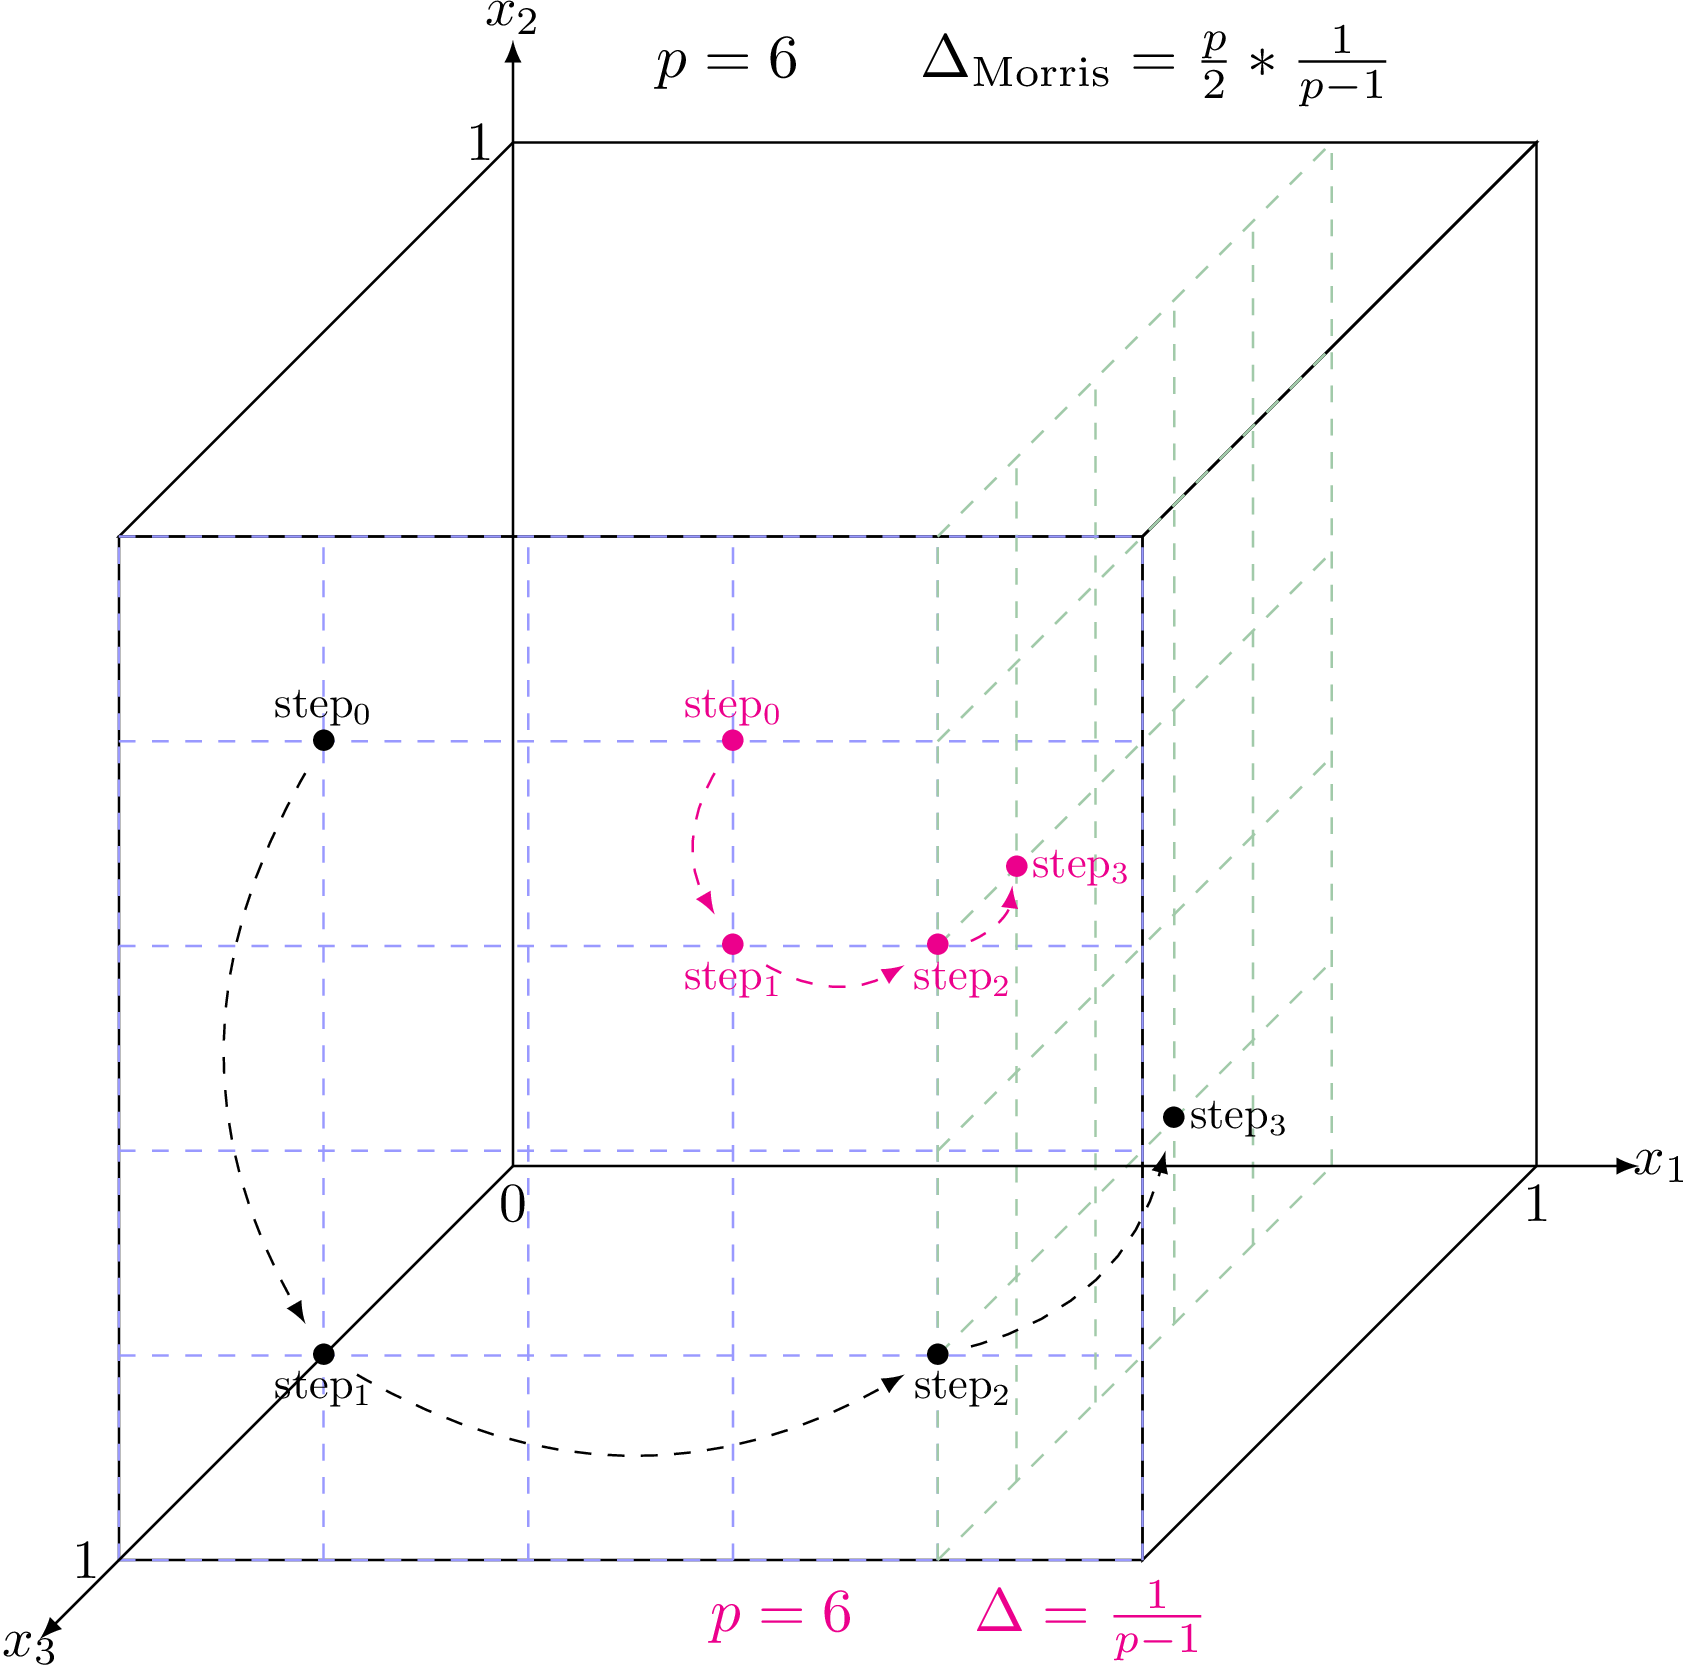
is then  . This method is schematised in Figure V.1 for a problem with three
inputs. The hyper-volume is normalised and transformed into an unit hyper-cube. The resulting volume is discretised
with the requested level and two trajectories are drawn for different values of the elementary variation.
. This method is schematised in Figure V.1 for a problem with three
inputs. The hyper-volume is normalised and transformed into an unit hyper-cube. The resulting volume is discretised
with the requested level and two trajectories are drawn for different values of the elementary variation.

Figure V.1. Schematic view of two trajectories drawn randomly in the discretised hyper-volume (with p=6) for two different values of the elementary variation (the optimal one in black and the smallest one in pink, as detailed on the figure itself).
 |
With the repetition of this procedure times, it is possible to compute basic statistics on the elementary effects computed for every
input parameter, as

The variable
 and
and
 represents
respectively the mean and standard deviation of the elementary effects of the i-Th input parameters. In the case
where the model is not monotonic some
represents
respectively the mean and standard deviation of the elementary effects of the i-Th input parameters. In the case
where the model is not monotonic some  may cancel each other out, resulting in a low value even for an important factor. For that reason, a revised version
called
may cancel each other out, resulting in a low value even for an important factor. For that reason, a revised version
called  has been
created and defined as the mean of the absolute values of the [Salt08primer].
has been
created and defined as the mean of the absolute values of the [Salt08primer].
The results are usually visualised in the ( ,
, )
plane, allowing to sort its inputs in the following categories:
)
plane, allowing to sort its inputs in the following categories:
factors that have negligible effects on the output: both
and are small.
factors that have linear effects, without interaction with other inputs:
is large (all variations have an impact) but
is small (the
impact is the same independently of the starting point).
factors that have non-linear effects and/or interaction with other inputs: both
and are large.
Warning
The optimal value of given previously might be a dangerous choice in very few cases. When the
evolution of the output as a function of one input is  -periodic (when
  is the total range of the input under consideration), the "optimal" elementary variation will
lead to insensitive trajectories. In this precise cases, one might want to change elementary variation.
is the total range of the input under consideration), the "optimal" elementary variation will
lead to insensitive trajectories. In this precise cases, one might want to change elementary variation.
| |  | |
| V.3. The regression method |  | V.5. The Sobol method |