

Documentation
/ Guide méthodologique
: 
| V.8. Sensitivity Indices based on HSIC | ||
|---|---|---|
 | Chapter V. Sensitivity analysis |  |
The sensivity measures based on Hilbert-Schmidt independence criterion (HSIC) [Gretton05,DaVeiga15] aims at analyzing the influence
of input variables  on the output variables
  determining the dependance computing the dissimilary between the joint distribution
  and the product of the marginal distributions
  .
.


on the output variables
determining the dependance computing the dissimilary between the joint distribution and the product of the marginal distributions .
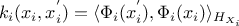
We associate respectively to  and
Reproducing Kernel Hilbert Space (RKHS)
and
Reproducing Kernel Hilbert Space (RKHS)
 and
and
 associating projection functions
 and
and
 defined by characteristic kernels
 and
and
 . Data are projected in a characteristic space using the kernel
trick operation.
. Data are projected in a characteristic space using the kernel
trick operation.
The advantage of this approach is that the projection has not to be known, we just need to arbitrary define the kernel. Using the kernel trick operation, the HSIC measure, defined as Hilbert-Shmidt of the cross covariance operator, is expressed as
which is estimated as
with
where  is the Kronecker operator
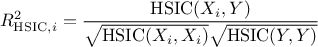
Sensitivity indices are therefore defined such as
is the Kronecker operator
Sensitivity indices are therefore defined such as
These indices are mainly used for screening or ranking the parameters.
| |  | |
| V.7. The Johnson relative weight |  | Chapter VI. Dealing with optimisation issues |