13.6.3. Macro “sensitivityDataBaseFlowrate.py”
13.6.3.1. Objective
The objective of this macro is to perform a SRC regression on data stored in a TDataServer. Data are
loaded in the TDataServer from an ASCII data file flowrateUniformDesign.dat:
#NAME: flowrateborehole
#TITLE: Uniform design of flow rate borehole problem proposed by Ho and Xu(2000)
#COLUMN_NAMES: rw| r| tu| tl| hu| hl| l| kw | ystar
#COLUMN_TITLES: r_{#omega}| r | T_{u} | T_{l} | H_{u} | H_{l} | L | K_{#omega} | y^{*}
#COLUMN_UNITS: m | m | m^{2}/yr | m^{2}/yr | m | m | m | m/yr | m^{3}/yr

0.0500 33366.67  63070.0 116.00 1110.00 768.57 1200.0 11732.14  26.18
0.0500   100.00  80580.0  80.73 1092.86 802.86 1600.0 10167.86  14.46
0.0567   100.00  98090.0  80.73 1058.57 717.14 1680.0 11106.43  22.75
0.0567 33366.67  98090.0  98.37 1110.00 734.29 1280.0 10480.71  30.98
0.0633   100.00 115600.0  80.73 1075.71 751.43 1600.0 11106.43  28.33
0.0633 16733.33  80580.0  80.73 1058.57 785.71 1680.0 12045.00  24.60
0.0700 33366.67  63070.0  98.37 1092.86 768.57 1200.0 11732.14  48.65
0.0700 16733.33 115600.0 116.00  990.00 700.00 1360.0 10793.57  35.36
0.0767   100.0  115600.0  80.73 1075.71 751.43 1520.0 10793.57  42.44
0.0767 16733.33  80580.0  80.73 1075.71 802.86 1120.0  9855.00  44.16
0.0833 50000.00  98090.0  63.10 1041.43 717.14 1600.0 10793.57  47.49
0.0833 50000.00 115600.0  63.10 1007.14 768.57 1440.0 11419.29  41.04
0.0900 16733.33  63070.0 116.00 1075.71 751.43 1120.0 11419.29  83.77
0.0900 33366.67 115600.0 116.00 1007.14 717.14 1360.0 11106.43  60.05
0.0967 50000.00  80580.0  63.10 1024.29 820.00 1360.0  9855.00  43.15
0.0967 16733.33  80580.0  98.37 1058.57 700.00 1120.0 10480.71  97.98
0.1033 50000.00  80580.0  63.10 1024.29 700.00 1520.0 10480.71  74.44
0.1033 16733.33  80580.0  98.37 1058.57 820.00 1120.0 10167.86  72.23
0.1100 50000.00  98090.0  63.10 1024.29 717.14 1520.0 10793.57  82.18
0.1100   100.00  63070.0  98.37 1041.43 802.86 1600.0 12045.00  68.06
0.1167 33366.67  63070.0 116.00  990.00 785.71 1280.0 12045.00  81.63
0.1167   100.00  98090.0  98.37 1092.86 802.86 1680.0  9855.00  72.5
0.1233 16733.33 115600.0  80.73 1092.86 734.29 1200.0 11419.29 161.35
0.1233 16733.33  63070.0  63.10 1041.43 785.71 1680.0 12045.00  86.73
0.1300 33366.67  80580.0 116.00 1110.00 768.57 1280.0 11732.14 164.78
0.1300   100.00  98090.0  98.37 1110.00 820.00 1280.0 10167.86 121.76
0.1367 50000.00  98090.0  63.10 1007.14 820.00 1440.0 10167.86  76.51
0.1367 33366.67  98090.0 116.00 1024.29 700.00 1200.0 10480.71 164.75
0.1433 50000.00  63070.0 116.00  990.00 785.71 1440.0  9855.00  89.54
0.1433 50000.00 115600.0  63.10 1007.14 734.29 1440.0 11732.14 141.09
0.1500 33366.67  63070.0  98.37  990.00 751.43 1360.0 11419.29 139.94
0.1500   100.00 115600.0  80.73 1041.43 734.29 1520.0 11106.43 157.59
13.6.3.2. Macro Uranie
"""
Example of sensitivity analysis through linear regression
"""
from URANIE import DataServer, Sensitivity
import ROOT

# Create a DataServer.TDataServer
tds = DataServer.TDataServer()
# Load a database in an ASCII file
tds.fileDataRead("flowrateUniformDesign.dat")

# Graph
Canvas = ROOT.TCanvas("c2", "Graph for the Macro", 5, 64, 1270, 667)
# Visualisation
tds.Draw("ystar:rw")

# Sensitivity analysis
treg = Sensitivity.TRegression(tds, "rw:r:tu:tl:hu:hl:l:kw", "ystar", "src")
treg.computeIndexes()

treg.drawIndexes("Flowrate", "", "hist, first")
# treg.getResultTuple().Scan()

# Graph
c = ROOT.gROOT.FindObject("__sensitivitycan__0")
can = ROOT.TCanvas("c1", "Graph for the Macro sensitivityDataBaseFlowrate",
                   5, 64, 1270, 667)
pad = ROOT.TPad("pad", "pad", 0, 0.03, 1, 1)
pad.Draw()
pad.Divide(2)
pad.cd(1)
Canvas.DrawClonePad()
pad.cd(2)
c.DrawClonePad()
The TDataServer is filled with the data file flowrateUniformDesign.dat through the fileDataRead method:
tds.fileDataRead("flowrateUniformDesign.dat")
The regression is performed on all the variables with a SRC method and sensitivity indexes are computed:
treg = Sensitivity.TRegression(tds, "rw:r:tu:tl:hu:hl:l:kw", "ystar", "src")
treg.computeIndexes()
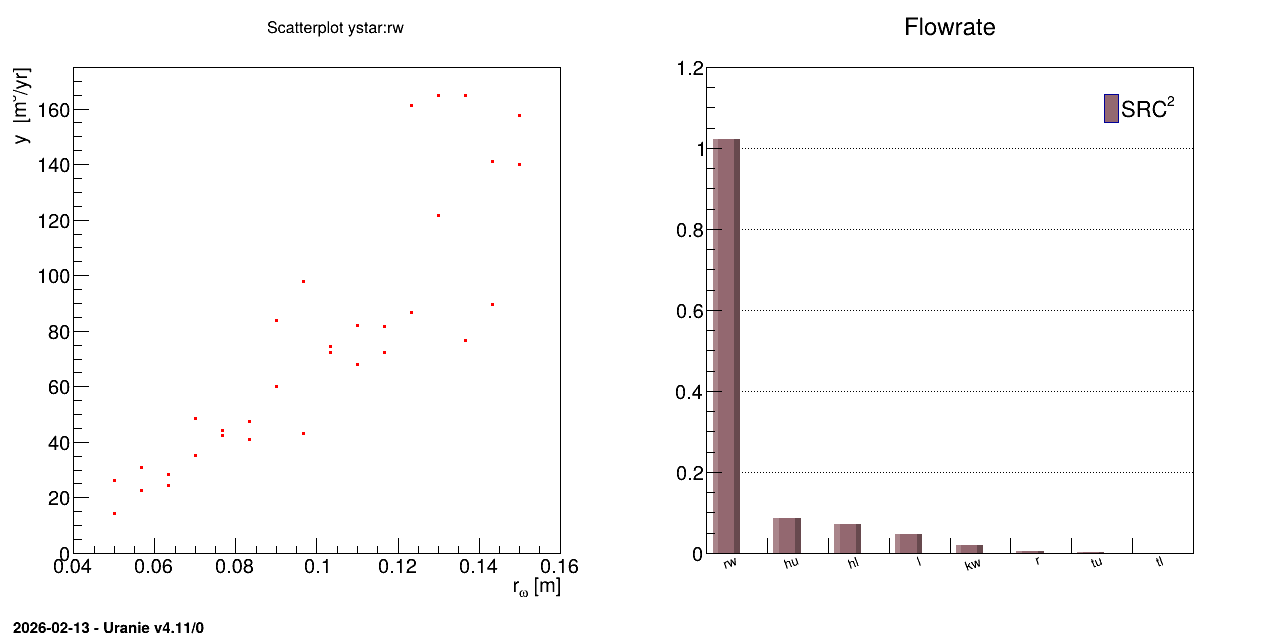
13.6.3.3. Graph
Figure 13.19 Graph of the macro “sensitivityDataBaseFlowrate.py”