13.6.13. Macro “sensitivitySobolRe-estimation.py”
13.6.13.1. Objective
The objective of this macro is to perform a full Sobol analysis using the existing file created when the Sobol class is allowed to perform the design-of-experiments and the estimations by itself (see the first item in the tip box in Computation of Sobol’s sensitivity indices for more details). This would mean that the only computation done would be to estimate the coefficients (no external code / function called).
Warning
The ref_sobol_launching_.dat file used as input is not provided in the usual sub-directory
“/share/uranie/macros” of the installation folder of Uranie ($URANIESYS) but can be generated
by the user by running the macro discussed in Macro “sensitivitySobolFunctionFlowrate.py”.
13.6.13.2. Macro Uranie
"""
Example of sobol re-estimation
"""
from URANIE import DataServer, Sensitivity
import ROOT

ROOT.gROOT.LoadMacro("UserFunctions.C")

# Define the DataServer
tds = DataServer.TDataServer("tdsflowreate", "DataBase flowreate")
tds.fileDataRead("ref_sobol_launching_.dat")

tsobol = Sensitivity.TSobol(tds, "rw:r:tu:tl:hu:hl:l:kw", "flowrateModel")
tsobol.setDrawProgressBar(False)
tsobol.computeIndexes()

cc = ROOT.TCanvas("c1", "histgramme", 5, 64, 1270, 667)
pad = ROOT.TPad("pad", "pad", 0, 0.03, 1, 1)
pad.Draw()
pad.Divide(2, 1)
pad.cd(1)
tsobol.drawIndexes("Flowrate", "", "nonewcanv, hist, all")

pad.cd(2)
tsobol.drawIndexes("Flowrate", "", "nonewcanv, pie, first")
There are no external code or function to be run here. The input file ref_sobol_launching_.dat has
to be generated by the use of sensitivtySobolFunctionFlowrate.py. Once done it is loaded into the dataserver and
the TSobol object is constructed from the simplest constructor with only the pointer to the dataserver,
the input and output list:
tsobol = Sensitivity.TSobol(tds, "rw:r:tu:tl:hu:hl:l:kw", "flowrateModel")
Once done, the computeIndexes() method is called and few lines are shown to display the results in
the classical plot form, leading to the figure below (it is provided to illustrate how to represent
results). The numerical results are shown in the console below and are identical to the ones shown in
Console from where the full sample is coming from.
13.6.13.3. Graph
The results of the previous macro is shown in Figure 13.29, where the evolution of the sobol coefficient is shown for all inputs with the uncertainty band, for the first order coefficient and the total one, respectively on the top and bottom panel.
Figure 13.29 Graph of the macro “sensitivitySobolRe-estimation.py”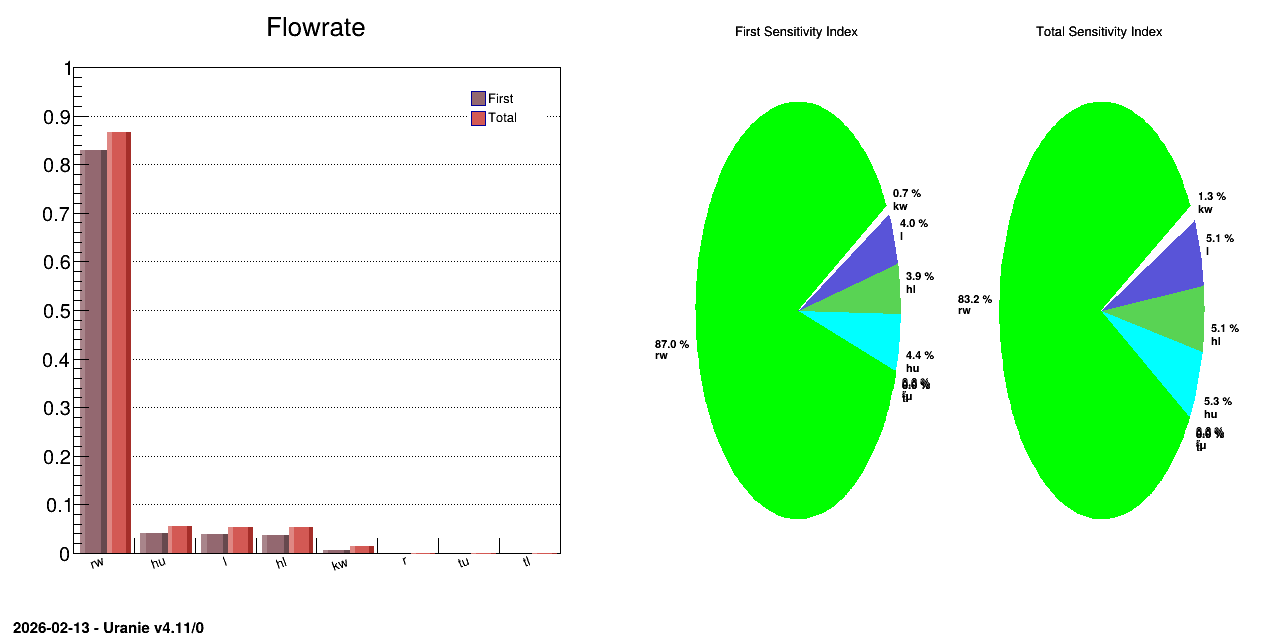
13.6.13.4. Console
--- Uranie v4.11/0 --- Developed with ROOT (6.36.06)
                      Copyright (C) 2013-2026 CEA/DES
                      Contact: support-uranie@cea.fr
                      Date: Thu Feb 12, 2026

 ** Case of Output atty [flowrateModel]  nSimPerIndex 10000
 ** Input att [rw] First [0.830033] Total Order[0.865762]
 ** Input att [r] First [0] Total Order[0.000102212]
 ** Input att [tu] First [0] Total Order[0.0001]
 ** Input att [tl] First [0] Total Order[0.000110756]
 ** Input att [hu] First [0.0417298] Total Order[0.0554922]
 ** Input att [hl] First [0.0367345] Total Order[0.0526188]
 ** Input att [l] First [0.0384214] Total Order[0.0535728]
 ** Input att [kw] First [0.00669831] Total Order[0.0132316]