13.6.7. Macro “sensitivityMorrisFunctionFlowrateRunner.py”
13.6.7.1. Objective
The objective of this macro is to perform a Morris sensitivity analysis on a set of eight parameters
used in the flowrateModel model described in Presentation of the problem, but
this time using the Relauncher architecture.
13.6.7.2. Macro Uranie
"""
Example of Morris analysis on flowrate with a Relauncher approach
"""
from URANIE import DataServer, Relauncher, Sensitivity
import ROOT

ROOT.gROOT.LoadMacro("UserFunctions.C")

# Define the DataServer
rw = DataServer.TUniformDistribution("rw", 0.05, 0.15)
r = DataServer.TUniformDistribution("r", 100.0, 50000.0)
tu = DataServer.TUniformDistribution("tu", 63070.0, 115600.0)
tl = DataServer.TUniformDistribution("tl", 63.1, 116.0)
hu = DataServer.TUniformDistribution("hu", 990.0, 1110.0)
hl = DataServer.TUniformDistribution("hl", 700.0, 820.0)
lvar = DataServer.TUniformDistribution("l", 1120.0, 1680.0)
kw = DataServer.TUniformDistribution("kw", 9855.0, 12045.0)

# Create the evaluator
code = Relauncher.TCIntEval("flowrateModel")
# Create output attribute
yout = DataServer.TAttribute("flowrateModel")
# Provide input/output attributes to the assessor
code.addInput(rw)
code.addInput(r)
code.addInput(tu)
code.addInput(tl)
code.addInput(hu)
code.addInput(hl)
code.addInput(lvar)
code.addInput(kw)
code.addOutput(yout)

run = Relauncher.TSequentialRun(code)  # Replace to distribute computation
run.startSlave()
if run.onMaster():
    # Create the dataserver
    tds = DataServer.TDataServer("sobol", "foo bar pouet chocolat")
    tds.addAttribute(rw)
    tds.addAttribute(r)
    tds.addAttribute(tu)
    tds.addAttribute(tl)
    tds.addAttribute(hu)
    tds.addAttribute(hl)
    tds.addAttribute(lvar)
    tds.addAttribute(kw)

    # Create the Morris object
    nreplique = 3
    nlevel = 10
    scmo = Sensitivity.TMorris(tds, run, nreplique, nlevel)
    scmo.setDrawProgressBar(False)
    scmo.generateSample()

    tds.exportData("_morris_sampling_.dat")
    scmo.computeIndexes()

    tds.exportData("_morris_launching_.dat")

    ntresu = scmo.getMorrisResults()
    ntresu.Scan("*")

    # Graph
    canmoralltraj = ROOT.gROOT.FindObject("canmoralltraj")
    can = ROOT.TCanvas("c1", "Graph sensitivityMorrisFunctionFlowrateRunner",
                       5, 64, 1270, 667)
    pad = ROOT.TPad("pad", "pad", 0, 0.03, 1, 1)
    pad.Draw()
    pad.Divide(2)
    pad.cd(1)
    scmo.drawSample("", -1, "nonewcanv")
    pad.cd(2)
    scmo.drawIndexes("mustar", "", "nonewcanv")
The function flowrateModel is loaded from the macro UserFunctions.C (the file can be found in
${URANIESYS}/share/uranie/macros)
ROOT.gROOT.LoadMacro("UserFunctions.C")
Each parameter is related to the TDataServer as a TAttribute and obeys an uniform law on specific interval:
# Define the DataServer
rw = DataServer.TUniformDistribution("rw", 0.05, 0.15)
r = DataServer.TUniformDistribution("r", 100.0, 50000.0)
tu = DataServer.TUniformDistribution("tu", 63070.0, 115600.0)
tl = DataServer.TUniformDistribution("tl", 63.1, 116.0)
hu = DataServer.TUniformDistribution("hu", 990.0, 1110.0)
hl = DataServer.TUniformDistribution("hl", 700.0, 820.0)
lvar = DataServer.TUniformDistribution("l", 1120.0, 1680.0)
kw = DataServer.TUniformDistribution("kw", 9855.0, 12045.0)
The interface to the function is then defined, using the Relauncher interface, through a TCIntEval
object and a sequential runner. On the contrary to the C++ script, python cannot use methods such as setInputs or
setOutputs and the inputs and outputs have to be included ony-by-one.
# Create the evaluator
code = Relauncher.TCIntEval("flowrateModel")
# Create output attribute
yout = DataServer.TAttribute("flowrateModel")
# Provide input/output attributes to the assessor
code.addInput(rw)
code.addInput(r)
code.addInput(tu)
code.addInput(tl)
code.addInput(hu)
code.addInput(hl)
code.addInput(lvar)
code.addInput(kw)
code.addOutput(yout)

run = Relauncher.TSequentialRun(code)  # Replace to distribute computation
run.startSlave()
The dataserver object is defined only on the master to avoid useless replication if one wants to run
the estimation of the function in parallel (by changing the TSequentialRun by either a TThreadedRun
or a TMpiRun). To instantiate the TMorris object, one uses the TDataServer, a pointer to the chosen
runner, the number of replicas (here nreplique=3), the level parameter (here nlevel=10)
scmo = Sensitivity.TMorris(tds, run, nreplique, nlevel)
Creation of the sampling:
scmo.generateSample()
Data are exported in an ASCII file:
tds.exportData("_morris_sampling_.dat")
Computation of sensitivity indexes:
scmo.computeIndexes()
The rest of the code is providing command to get a final plot.
13.6.7.3. Graph
Figure 13.23 Graph of the macro “sensitivityMorrisFunctionFlowrateRunner.py”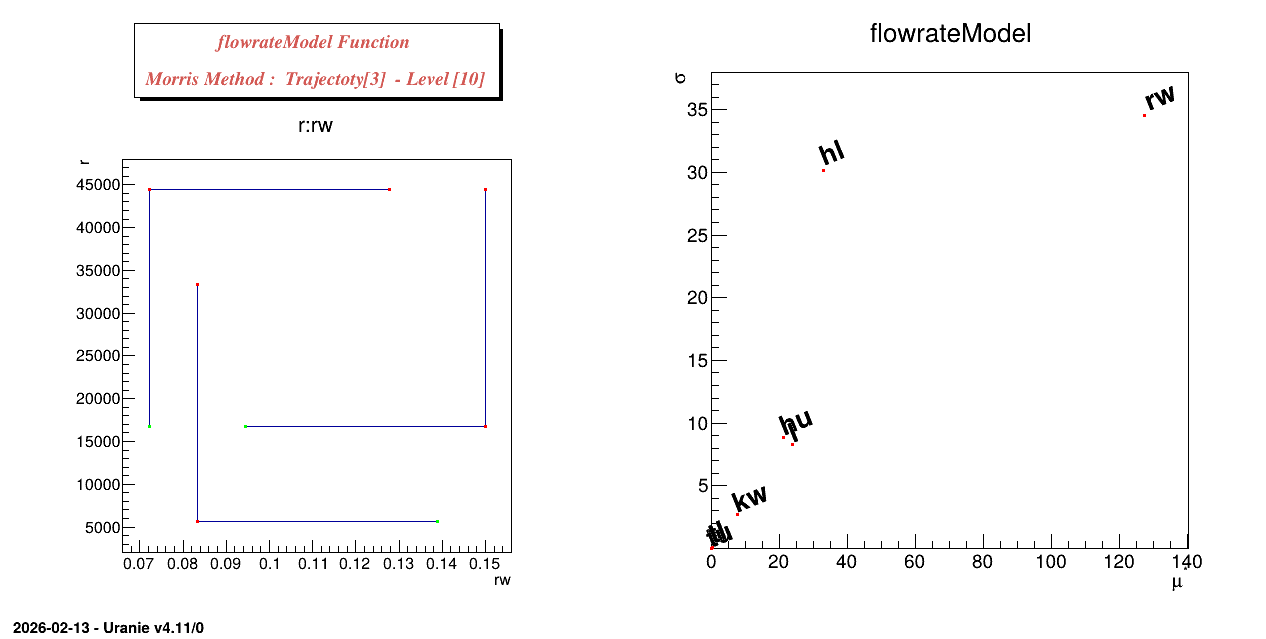
13.6.7.4. Console
************************************************************************
*    Row   *     Input *    Output *     mu.mu * mustar.mu * sigma.sig *
************************************************************************
*        0 *        rw * flowrateM * 127.47900 * 127.47900 * 34.521839 *
*        1 *         r * flowrateM * -0.069601 * 0.0696013 * 0.0793689 *
*        2 *        tu * flowrateM * 0.0004201 * 0.0004201 * 0.0004641 *
*        3 *        tl * flowrateM * 0.4659763 * 0.4659763 * 0.3301256 *
*        4 *        hu * flowrateM * 21.192361 * 21.192361 * 8.8498989 *
*        5 *        hl * flowrateM * -32.74887 * 32.748874 * 30.146134 *
*        6 *         l * flowrateM * -23.89328 * 23.893280 * 8.2781934 *
*        7 *        kw * flowrateM * 7.5766167 * 7.5766167 * 2.7457665 *
************************************************************************