13.6.17. Macro “sensitivityJohnsonRWCorrelatedFunctionFlowrate.py”
13.6.17.1. Objective
The objective of this macro is to perform a sensitivity analysis using the Johnson’s relative weight
method on a set of eight parameters used in the flowrateModel model described in
Presentation of the problem. Compared to version detailled in
Macro “sensitivityJohnsonRWFunctionFlowrate.py”, the idea is here to correlate the input variables with
a random correlation matrix.
13.6.17.2. Macro Uranie
"""
Example of Johson relative weight method applied to flowrate
"""
from math import sqrt
from URANIE import DataServer, Sensitivity
import ROOT

def gen_corr(_nx=8, correlated=True, seed=0):
    """Generate randomly a good, highly-correlated, input correlation matrix."""
    # Define a randomly filled matrix
    a_mat = ROOT.TMatrixD(_nx, _nx)
    for i in range(_nx):
        for j in range(_nx):
            a_mat[i][j] = ROOT.gRandom.Gaus(0, 1)

    # Compute AA^T and normalise it to get "covariance matrix"
    gamma = ROOT.TMatrixD(a_mat, ROOT.TMatrixD.kMultTranspose, a_mat)
    gamma *= 1. / _nx

    # Inverse of the diagonal matrix to do as if this was 1/sqrt(variance)
    sig = ROOT.TMatrixD(_nx, _nx)
    for i in range(_nx):
        sig[i][i] = 1. / sqrt(gamma[i][i])

    # Compute the input correlation matrix
    in_corr_right = ROOT.TMatrixD(gamma, ROOT.TMatrixD.kMult, sig)
    in_corr = ROOT.TMatrixD(sig, ROOT.TMatrixD.kMult, in_corr_right)
    if not correlated:
        in_corr.UnitMatrix()

    return in_corr


ROOT.gROOT.LoadMacro("UserFunctions.C")

# Define the DataServer
tds = DataServer.TDataServer("tdsflowrate", "DataBase flowrate")
tds.addAttribute(DataServer.TUniformDistribution("rw", 0.05, 0.15))
tds.addAttribute(DataServer.TUniformDistribution("r", 100.0, 50000.0))
tds.addAttribute(DataServer.TUniformDistribution("tu", 63070.0, 115600.0))
tds.addAttribute(DataServer.TUniformDistribution("tl", 63.1, 116.0))
tds.addAttribute(DataServer.TUniformDistribution("hu", 990.0, 1110.0))
tds.addAttribute(DataServer.TUniformDistribution("hl", 700.0, 820.0))
tds.addAttribute(DataServer.TUniformDistribution("l", 1120.0, 1680.0))
tds.addAttribute(DataServer.TUniformDistribution("kw", 9855.0, 12045.0))

# \param Size of a sampling.
nS = 1000
FuncName = "flowrateModel"

# Get a correlation matrix for the inputs
inCorr = gen_corr(8, True, args.seed)
inCorr.Print()

tjrw = Sensitivity.TJohnsonRW(tds, FuncName, nS,
                              "rw:r:tu:tl:hu:hl:l:kw", FuncName)
# Set the correlation
tjrw.setInputCorrelationMatrix(inCorr)
tjrw.computeIndexes()

# Get the results on screen
tjrw.getResultTuple().Scan("Out:Inp:Method:Value", "Order==\"First\"")

# Get the results as plots
cc = ROOT.TCanvas("canhist", "histgramme")
tjrw.drawIndexes("Flowrate", "", "nonewcanv, hist, first")
cc.Print("appliUranieFlowrateJohnsonRWCorrelated1000Histogram_py.png")

ccc = ROOT.TCanvas("canpie", "TPie")
tjrw.drawIndexes("Flowrate", "", "nonewcanv, pie")
ccc.Print("appliUranieFlowrateJohnsonRWCorrelated1000Pie_py.png")
The first function, called GenCorr, is not discussed, because it is really technical and not really
interesting here. The only thing to know is that it provides a proper correlation matrix: a
positive-definite symmetrical matrix.
The function flowrateModel is loaded from the macro UserFunctions.C (the file can be found in
${URANIESYS}/share/uranie/macros)
ROOT.gROOT.LoadMacro("UserFunctions.C")
Compared to the discussion in Macro Uranie,
the instantiation of the attributes and the TJohnsonRW object is the same. The only difference is
done when injecting the correlation matrix, which is done in these lines:
# Get a correlation matrix for the inputs
inCorr = gen_corr(8, True, args.seed)
tjrw = Sensitivity.TJohnsonRW(tds, FuncName, nS,
                              "rw:r:tu:tl:hu:hl:l:kw", FuncName)
# Set the correlation
tjrw.setInputCorrelationMatrix(inCorr)
The computation of sensitivity indices can finally be done:
tjrw.computeIndexes()
The rest is very common to all sensitivity macros discussed here: it will produce two plots (the first one being a histogram show below) and the console is also shown below for completness.
13.6.17.3. Graph
Figure 13.33 Graph of the macro “sensitivityJohnsonRWCorrelatedFunctionFlowrate.py”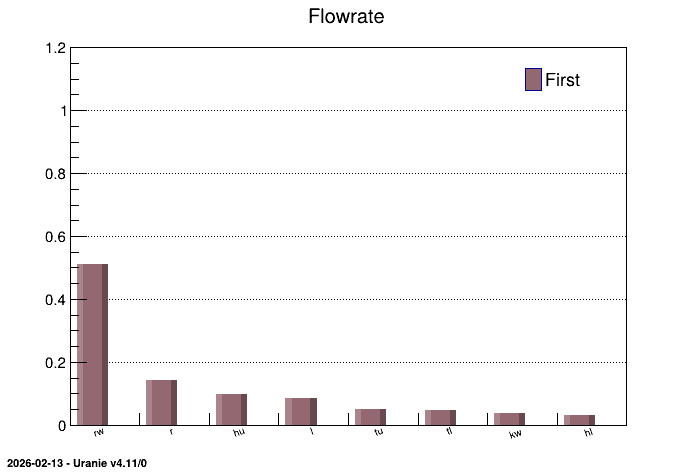
13.6.17.4. Console
--- Uranie v4.11/0 --- Developed with ROOT (6.36.06)
                      Copyright (C) 2013-2026 CEA/DES
                      Contact: support-uranie@cea.fr
                      Date: Thu Feb 12, 2026


8x8 matrix is as follows

     |      0    |      1    |      2    |      3    |      4    |
----------------------------------------------------------------------
   0 |          1      0.4488      0.2894    -0.05727      0.3627
   1 |     0.4488           1     0.02022     -0.2547      0.3764
   2 |     0.2894     0.02022           1      0.4982     -0.2078
   3 |   -0.05727     -0.2547      0.4982           1     -0.9199
   4 |     0.3627      0.3764     -0.2078     -0.9199           1
   5 |     0.2569     -0.1996      -0.288      0.1004     -0.1362
   6 |    -0.2167     -0.4425    0.004268      0.1412      -0.111
   7 |    -0.2948      0.1982   -0.001661      0.1943     -0.3131


     |      5    |      6    |      7    |
----------------------------------------------------------------------
   0 |     0.2569     -0.2167     -0.2948
   1 |    -0.1996     -0.4425      0.1982
   2 |     -0.288    0.004268   -0.001661
   3 |     0.1004      0.1412      0.1943
   4 |    -0.1362      -0.111     -0.3131
   5 |          1     -0.1943      0.2848
   6 |    -0.1943           1     -0.4415
   7 |     0.2848     -0.4415           1

 <URANIE::WARNING>
 <URANIE::WARNING> *** URANIE WARNING ***
 <URANIE::WARNING> *** File[${SOURCEDIR}/dataSERVER/souRCE/TDataServer.cxx] Line[8531]
 <URANIE::WARNING> TDataServer::getTuple Error : There is no tree!
 <URANIE::WARNING> *** END of URANIE WARNING ***
 <URANIE::WARNING>
 <URANIE::INFO>
 <URANIE::INFO> *** URANIE INFORMATION ***
 <URANIE::INFO> *** File[${SOURCEDIR}/meTIER/sampler/souRCE/TSamplerStochastic.cxx] Line[66]
 <URANIE::INFO> TSamplerStochastic::init: the TDS [tdsflowrate] contains data: we need to empty it !
 <URANIE::INFO> *** END of URANIE INFORMATION ***
 <URANIE::INFO>
************************************************************
*    Row   *       Out *       Inp *    Method *     Value *
************************************************************
*        0 * flowrateM *        rw * JohnsonRW * 0.5113911 *
*        2 * flowrateM *         r * JohnsonRW * 0.1409327 *
*        4 * flowrateM *        tu * JohnsonRW * 0.0505176 *
*        6 * flowrateM *        tl * JohnsonRW * 0.0482684 *
*        8 * flowrateM *        hu * JohnsonRW * 0.0969452 *
*       10 * flowrateM *        hl * JohnsonRW * 0.0306674 *
*       12 * flowrateM *         l * JohnsonRW * 0.0836757 *
*       14 * flowrateM *        kw * JohnsonRW * 0.0376016 *
*       16 * flowrateM *    __R2__ * JohnsonRW * 0.9500813 *
*       18 * flowrateM *   __R2A__ * JohnsonRW * 0.9496787 *
************************************************************
==> 10 selected entries