

Documentation
/ Manuel utilisateur en C++
: 
| II.4. Statistical treatments and operations | ||
|---|---|---|
 | Chapter II. The DataServer module |  |
This section presents the statistical computations allowed on the attributes in a TDataServer through the following five main
groups of method.
All the methods have been adapted to cope with the case of vector: a check is performed, allowing the computation to be done only if the number of element in the vector is constant (at least throughout the selection if one is requested). If the constant-size criterion is not fulfilled, the considered vector is disregarded for this method. The methods detailed here are:
The normalisation of variable, in Section II.4.1
The ranking of variable, in Section II.4.2
The elementary statistic computation, in Section II.4.3
The quantile estimation, in Section II.4.4
The correlation matrix determination, in Section II.4.5
The normalisation function normalize can be called to create
new attributes whose range and dispersion depend on the chosen normalisation method. This
function can be called without argument but also using up to four ones (the list of which is given in the summary
below). Up to now, there are four different ways to perform this normalisation:
centered-reducted (enum value
kCR): the new variable values are computed as
centered (enum value
kCentered): the new variable values are computed as
reduced to
 (enum value
 kMinusOneOne): the new variable values are computed as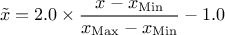
reduced to
 (enum value
 kZeroOne): the new variable values are computed as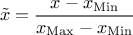
The following piece of code shows how to use this function on a very simple dataserver, focusing on a vector whose values goes from 1 to 9 over three events.
{
  TDataServer *tdsop =new TDataServer("foo","pouet");
  tdsop->fileDataRead("tdstest.dat");

  //Compute a global normalisation of v, CenterReduced
  tdsop->normalize("v","GCR",TDataServer::kCR,true);
  //Compute a normalisation of v, CenterReduced (not global but entry by entry)
  tdsop->normalize("v","CR",TDataServer::kCR,false);

  //Compute a global normalisation of v, Centered
  tdsop->normalize("v","GCent",TDataServer::kCentered);
  //Compute a normalisation of v, Centered  (not global but entry by entry)
  tdsop->normalize("v","Cent",TDataServer::kCentered,false);

  //Compute a global normalisation of v, ZeroOne
  tdsop->normalize("v","GZO",TDataServer::kZeroOne);
  //Compute a normalisation of v, ZeroOne (not global but entry by entry)
  tdsop->normalize("v","ZO",TDataServer::kZeroOne,false);

  //Compute a global normalisation of v, MinusOneOne
  tdsop->normalize("v","GMOO",TDataServer::kMinusOneOne,true);
  //Compute a normalisation of v, MinusOneOne (not global but entry by entry)
  tdsop->normalize("v","MOO",TDataServer::kMinusOneOne,false);

  tdsop->scan("v:vGCR:vCR:vGCent:vCent:vGZO:vZO:vGMOO:vMOO","","colsize=4 col=2:5::::::::");
  }
The normalisation is performed using all methods, first with the global flag set to true (the suffix always starts
with "G" for global) and then with the more local approach. The result of the scan method is
given below:
*************************************************************************************
*    Row   * Instance *  v *  vGCR *  vCR * vGCe * vCen * vGZO *  vZO * vGMO * vMOO *
*************************************************************************************
*        0 *        0 *  1 * -1.46 *   -1 *   -4 *   -3 *    0 *    0 *   -1 *   -1 *
*        0 *        1 *  2 * -1.09 *   -1 *   -3 *   -3 * 0.12 *    0 * -0.7 *   -1 *
*        0 *        2 *  3 * -0.73 *   -1 *   -2 *   -3 * 0.25 *    0 * -0.5 *   -1 *
*        1 *        0 *  4 * -0.36 *    0 *   -1 *    0 * 0.37 *  0.5 * -0.2 *    0 *
*        1 *        1 *  5 *     0 *    0 *    0 *    0 *  0.5 *  0.5 *    0 *    0 *
*        1 *        2 *  6 * 0.365 *    0 *    1 *    0 * 0.62 *  0.5 * 0.25 *    0 *
*        2 *        0 *  7 * 0.730 *    1 *    2 *    3 * 0.75 *    1 *  0.5 *    1 *
*        2 *        1 *  8 * 1.095 *    1 *    3 *    3 * 0.87 *    1 * 0.75 *    1 *
*        2 *        2 *  9 * 1.460 *    1 *    4 *    3 *    1 *    1 *    1 *    1 *
*************************************************************************************
The ranking of variable is used in many methods that are focusing more on monotony than on linearity (this is
discussed throughout this documentation when coping with regression, correlation matrix, ...). The way this is done in Uranie is the following: for every attribute considered,
(which means all attributes by default if the function is called without argument) a
new attribute is created, whose name is constructed as the name of the considered attribute with the prefix "Rk_". The
ranking consists, for a simple double-precision attribute, in assigning to each
attribute entry an integer, that goes from 1 to the number of patterns, following an order relation (in Uranie it is
chosen so that 1 is the smallest value and  is the largest one).
This method has been modified in order to cope with constant size vectors, but also to stabilise its
behaviour when going from one compiler version to another. The first modification only consists in considering every
element of a constant-size vector independent from the others, so every element is in fact treated as if they were
different attributes. The second part is more technical as the sorting method has been changed to use the
std::stable_sort insuring that platforms (operating systems and compiler versions) will have
the same behaviour. The main problem was raising when two patterns had the same value for the attribute under
study. In this case, the ranking was not done in the same way depending on the version of the compiler. Now it should
be treated in the same way: if two or more patterns have the same value for a specific attribute, the first met in
the array of attribute value will have the value  while the second one will be affected with
  and so on... Here is a small example of this computation:
{
  TDataServer *tdsGeyser =new TDataServer("geyser","poet");
  tdsGeyser->fileDataRead("geyser.dat");
  tdsGeyser->computeRank("x1");
  tdsGeyser->computeStatistic("Rk_x1");

  cout<<"NPatterns="<<tdsGeyser->getNPatterns()<<";  min(Rk_x1)= "<<tdsGeyser->getAttribute("Rk_x1")->getMinimum()
      <<";  max(Rk_x1)= "<<tdsGeyser->getAttribute("Rk_x1")->getMaximum()<<endl;

  }
This macro should returns
NPatterns=272; min(Rk_x1)= 1; max(Rk_x1)= 272
The TDataServer provides a method to determine the four simplest statistical notions: the minimum, maximum, average
and standard deviation. It can be simply called without argument (running then over all the
attributes), or with a restricted list of attributes. A second possible argument is a selection criteria (which is
not applied through the setSelect method so not changing the behaviour of the TDataServer in the
other method).
{
  TDataServer *tdsGeyser =new TDataServer("geyser","poet");
  tdsGeyser->fileDataRead("geyser.dat");
  tdsGeyser->computeStatistic("x1");

  cout<<"min(x1)= "<<tdsGeyser->getAttribute("x1")->getMinimum()<<";  max(x1)= "<<tdsGeyser->getAttribute("x1")->getMaximum()
      <<";  mean(x1)= "<<tdsGeyser->getAttribute("x1")->getMean()<<";  std(x1)= "<<tdsGeyser->getAttribute("x1")->getStd()<<endl;
  }
It returns the following line
min(x1)= 1.6; max(x1)= 5.1; mean(x1)= 3.48778; std(x1)= 1.14137
As stated in Section II.2.2, these
information are now stored in vectors because of the new possible attribute nature. In the case of constant-size
vectors whose dimension is , the
attribute-statistical vectors are filled with the statistical information considering every elements of the input
vector independent from the others. This results in attribute-statistical vectors of size  , the extra element being the statistical
information computed over the complete vector. Here is an example of
, the extra element being the statistical
information computed over the complete vector. Here is an example of computeStatistic
use with the tdstest.dat file already shown in Section II.3.4:
{
  TDataServer *tdsop =new TDataServer("foo","poet");
  tdsop->fileDataRead("tdstest.dat");

  //Considering every element of a vector independent from the others
  tdsop->computeStatistic("x");
  TAttribute *px = tdsop->getAttribute("x");

  cout<<"min(x[0])= "<<px->getMinimum(0)<<";  max(x[0])= "<<px->getMaximum(0)
      <<";  mean(x[0])= "<<px->getMean(0)<<";  std(x[0])= "<<px->getStd(0)<<endl;
  cout<<"min(x[1])= "<<px->getMinimum(1)<<";  max(x[1])= "<<px->getMaximum(1)
      <<";  mean(x[1])= "<<px->getMean(1)<<";  std(x[1])= "<<px->getStd(1)<<endl;
  cout<<"min(x[2])= "<<px->getMinimum(2)<<";  max(x[2])= "<<px->getMaximum(2)
      <<";  mean(x[2])= "<<px->getMean(2)<<";  std(x[2])= "<<px->getStd(2)<<endl;
  cout<<"min(xtot)= "<<px->getMinimum(3)<<";  max(xtot)= "<<px->getMaximum(3)
      <<";  mean(xtot)= "<<px->getMean(3)<<";  std(xtot)= "<<px->getStd(3)<<endl;

  //Statistic for a single realisation of a vector, not considering other events
  tdsop->addAttribute("Min_x","Min$(x)");
  tdsop->addAttribute("Max_x","Max$(x)");
  tdsop->addAttribute("Mean_x","Sum$(x)/Length$(x)");

  tdsop->scan("x:Min_x:Max_x:Mean_x","","colsize=5 col=2::::");
  }
The first computation is filling the vector of statistical elementary in the concerned attribute  . The first, second and third
 cout
line in the previous piece of code are dumping the statistical characteristics respectively for the first, second and
third element of the vector. The fourth one is giving the main characteristics considering the complete vector and
all the entries. The results of this example are shown below:
min(x[0])= 1;  max(x[0])= 7;  mean(x[0])= 3;  std(x[0])= 3.4641
min(x[1])= 2;  max(x[1])= 8;  mean(x[1])= 4.66667;  std(x[1])= 3.05505
min(x[2])= 3;  max(x[2])= 9;  mean(x[2])= 6.66667;  std(x[2])= 3.21455
min(xtot)= 1;  max(xtot)= 9;  mean(xtot)= 4.77778;  std(xtot)= 3.23179
This implementation has been chosen as ROOT offers access to another way of computing these notions if one wants to consider every element of a vector, assuming that every event is now independent from the others. Indeed it is possible to get the minimum, maximum and mean of a vector on an event-by-event basis by introducing a new attribute with a formula, as done in Section II.3.4. This is the second part of the code shown in the box above (using specific function from ROOT, that needs the sign "$" to be recognised). The results are shown below:
*****************************************************
*    Row   * Instance *  x * Min_x * Max_x * Mean_x *
*****************************************************
*        0 *        0 *  1 *     1 *     3 *      2 *
*        0 *        1 *  2 *     1 *     3 *      2 *
*        0 *        2 *  3 *     1 *     3 *      2 *
*        1 *        0 *  7 *     7 *     9 *      8 *
*        1 *        1 *  8 *     7 *     9 *      8 *
*        1 *        2 *  9 *     7 *     9 *      8 *
*        2 *        0 *  1 *     1 *     8 * 4.3333 *
*        2 *        1 *  4 *     1 *     8 * 4.3333 *
*        2 *        2 *  8 *     1 *     8 * 4.3333 *
*****************************************************
There are several ways of estimating the quantiles implemented in Uranie. This part describes the most commonly used and starts with a definition of quantile.
A quantile  , as
discussed in the following parts, for p a probability going from 0 to 1, is the lowest value of the random variable
, as
discussed in the following parts, for p a probability going from 0 to 1, is the lowest value of the random variable
 leading to
  . This definition
holds equally if one is dealing with a given probability distribution (leading to a theoretical quantile), or a
sample, drawn from a known probability distribution or not (leading to an empirical quantile). In the latter case,
the sample is split into two sub-samples: one containing
. This definition
holds equally if one is dealing with a given probability distribution (leading to a theoretical quantile), or a
sample, drawn from a known probability distribution or not (leading to an empirical quantile). In the latter case,
the sample is split into two sub-samples: one containing  points, the other one containing
  points. It can be easily
pictured by looking at Figure II.44 which represents the cumulative distribution function (CDF)
of the attribute
points. It can be easily
pictured by looking at Figure II.44 which represents the cumulative distribution function (CDF)
of the attribute  . The quantile
at 50 percent for can be seen
by drawing an horizontal line at 0.5, the value of interest being the one on the abscissa where this line crosses the
CDF curve.
. The quantile
at 50 percent for can be seen
by drawing an horizontal line at 0.5, the value of interest being the one on the abscissa where this line crosses the
CDF curve.
For a given probability  , the
corresponding quantile
, the
corresponding quantile  is given
by:
is given
by:
where  is the k-Th smallest value of the attribute set-of-value (whose size is
). The
way
is the k-Th smallest value of the attribute set-of-value (whose size is
). The
way  is computed is discussed
later on, as a parameter of the functions.
is computed is discussed
later on, as a parameter of the functions.
The implementation and principle has slightly changed in order to be able to cope with vectors (even though the previous logic has been kept for consistency and backward compatibility). Let's start with an example of the way it was done with the two main methods whose name are the same but differ by their signature.
double aproba=0.5, aquant=0;
tdsGeyser->computeQuantile("x2", aproba, aquant);

double Proba[2]={0.05,0.95}; double Quant[2]={0,0};
tdsGeyser->computeQuantile("x2", 2, Proba, Quant);

cout<<"Quant[0]="<<Quant[0]<<"; aquant="<<aquant<<"; Quant[1]="<<Quant[1]<<endl;
tdsGeyser->computeQuantile("x2", 2, Proba, Quant);
cout<<"Quant[0]="<<Quant[0]<<"; aquant="<<aquant<<"; Quant[1]="<<Quant[1]<<endl; 
Description of the methods and results
This function takes here three mandatory arguments: the attribute name, the value of the chosen probability and a double whose value will be changed in the function to the estimated result. | |
This function takes here four mandatory arguments: the attribute name, the number | |
This line shows the results of the three previous computations. |

This implementation has been slightly modified for two reasons: to adapt the method to the case of vectors
and to store easily the results and prevent from recomputing already existing results. Even though the previous
behaviour is still correct, the information is now stored in the attribute itself, as a vector of map. For every
element of a vector, a map of format map<double,double> is created: the first double
is the key, meaning the value of probability provided by the user, while the second double is the results. It is
now highly recommended to use the method of the TAttribute, that gives access to these maps
for two reasons: the results provided by the methods detailed previously are only correct for the last element of a
vector, and the vector of map just discussed here is cleared as soon as the general selection is modified (as for
the elementary statistical-vectors discussed in Section II.4.3). The next example uses the following input
file, named aTDSWithVectors.dat:
#NAME: cho
#COLUMN_NAMES: x|rank
#COLUMN_TYPES: D|V

0 0,1
1 2,3
2 4,5
3 6,7
4 8,9
From this file, the following code (that can be find in Section XIV.2.14) shows the different methods created in the attribute class in order for the user to get back the computed values:
{
    TDataServer *tdsvec = new TDataServer("foo", "bar");
    tdsvec->fileDataRead("aTDSWithVectors.dat");

    double probas[3]={0.2, 0.6, 0.8}; double quants[3];
    tdsvec->computeQuantile("rank", 3, probas, quants);

    TAttribute *prank = tdsvec->getAttribute("rank");
    int nbquant;
    prank->getQuantilesSize(nbquant); // (1)
    cout << "nbquant = " << nbquant << endl;

    double aproba=0.8; double aquant;
    prank->getQuantile(aproba, aquant); // (2)
    cout << "aproba = " << aproba << ", aquant = " <<
    aquant << endl;

    double theproba[3], thequant[3];
    prank->getQuantiles(theproba, thequant); // (3)
    for(int i_quant=0; i_quant<nbquant; ++i_quant) {
        cout << "(theproba, thequant)[" << i_quant << "] = "
        << "(" << theproba[i_quant] << ", " <<
        thequant[i_quant] << ")" << endl;
    }

    vector<double> allquant;
    prank->getQuantileVector(aproba, allquant); // (4)
    cout << "aproba = " << aproba << ", allquant = ";
    for(double quant_i: allquant)
        cout << quant_i << " ";
    cout << endl;
}
Description of the methods and results
(1) This method changes the value of nbquant to the number of already computed and stored values of quantiles. A second argument can be provided to state which element of the vector is concerned (if the attribute under study is a vector, the default value being 0). (2) This method changes the value of aquant to the quantile value corresponding to a given probability aproba. A second argument can be provided to state which element of the vector is concerned (if the attribute under study is a vector, the default value being 0).
(3) As previously, this method changes the values of thequant to the quantile values corresponding to given
probabilities stores in theproba. A second argument can be provided to state which element of the vector is
concerned (if the attribute under study is a vector, the default value being 0). Warning: the size of both
arrays has to be carefully set. It is recommended to use the (4) This method fills the provided vector allquant with the quantile value of all element of the attribute under study corresponding to a given probability aproba. The results of this example are shown below: nbquant = 3 aproba = 0.8, aquant = 6.4 (theproba, thequant)[0] = (0.2, 1.6) (theproba, thequant)[1] = (0.6, 4.8) (theproba, thequant)[2] = (0.8, 6.4) aproba = 0.8, allquant = 6.4 7.4 |
Summary: computeQuantile
computeQuantile(const char *attName, Double_t proba, Double_t &quantile, Int_t type = 7);computeQuantile(const char *attName, Int_t nProba, Double_t * proba, Double_t *quantile, Int_t type = 7);The methods are discussed above. The last parameter determines how
is computed. For discontinuous cases:
1:

2:

3:
 , default in SAS.
For piece-wise linear interpolations:
4:

5:
6:
 , default in Minitab and SPSS.
7:
 , default in ROOT, S and R.
8:
 , approximately median unbiased.
9:
 , approximately unbiased if is normally distributed.
The α-quantile can be evaluated by several ways:
Control variate,
Importance sampling.
Control variate
To estimate the α-quantile by control variate, you must use the computeQuantileCV
method. The procedure to do this estimation is the following:
If the control variate is determined in the macro: A
TDataServeris necessary and a surrogate model, like "linear regression" or "artificial neural network", needs to be built from this dataserver and exported into a file (c.f. Chapter V). This model will enable the creation of the control variate.// Build the SR ( Linear regression + ANN) TLinearRegression *tlin = new TLinearRegression(tds,"rw:r:tu:tl:hu:hl:l:kw", sY); tlin->estimate(); tlin->exportFunction("c++", "_SR_rl_", "SRrl"); TANNModeler* tann=new TANNModeler(tds, Form("%s,8,%s",sinput.Data(),sY.Data())); tann->train(3, 2, "test"); tann->setDrawProgressBar(kFALSE); tann->exportFunction("c++", "_SR_ann_", "SRann");A variable that represents the control-variate is added to the
TDataServer. It is built by means of the surrogate model.//build Z gROOT->LoadMacro("_SR_rl_.C"); TLauncherFunction *tlfz = new TLauncherFunction(tds, "SRrl",sinput,"Z"); tlfz->setDrawProgressBar(kFALSE); tlfz->run();The Empirical α-quantile of the control variate needs to be evaluated. You can do it with the followings commands:
TDataServer *tdsza = new TDataServer( Form("%s_zalpha", tds2->GetName()), "Ex. flowrate");
for(Int_t i=0; i< nattinput; i++)
tdsza->addAttribute( tds2->getAttribute(i));

TSampling *fsza = new TSampling(tdsza, "lhs", 6000);
fsza->generateSample();

TLauncherFunction * tlfrlza = new TLauncherFunction(tdsza, "SRrl", sinput, "Zrl");
tlfrlza->setDrawProgressBar(kFALSE);
tlfrlza->run();

tdsza->computeQuantile("Zrl", dAlpha, dZrla);
cout<< dZrla  << endl;
Then, the estimation of the α-quantile can be made by using the
computeQuantileCVmethod.tds->computeQuantileCV("yhat",alpha,"Z",dZrla, dY, rho);
Importance sampling
To estimate the α-quantile by importance sampling, the method computeThreshold needs to
be used. The procedure to make this estimation follows.
First, an object TImportanceSampling needs to be created. This object will allow the creation of a copy of the
TDataServer where one of its attributes (sent in parameter) is replaced by a new attribute defined by its law (sent in
parameter too).
TImportanceSampling * tis = new TImportanceSampling(tds2,"rw",new TNormalDistribution("rw_IS", 0.10,0.015),nS);
And then, this new TDataServer must be collected via the getTDS method.
TDataServer *tdsis = tis->getTDS();
A sampling needs to be generated for this new TDataServer:
TSampling * sampis = new TSampling(tdsis,"lhs",nS);
sampis->generateSample();
TLauncherFunction *tlfis = new TLauncherFunction(tdsis,"flowrateModel","*","Y_IS");
tlfis->setDrawProgressBar(kFALSE);
tlfis->run();
Now, the probability of an output variable exceeding threshold can be computed with the
computeThreshold method.
ISproba = tis->computeThreshold("Y_IS",seuil); For information, it is possible to compute the mean and standard deviation of this output variable.
double ISmean =  tis->computeMean("Y_IS");
double ISstd =  tis->computeStd("Y_IS");
The Wilks quantile computation is an empirical estimation, based on order statistic which allows to get an
estimation on the requested quantile, with a given confidence level  , independently of the nature of the law, and most of the time,
requesting less estimations than a classical estimation. Going back to the empirical way discussed in Section II.4.4.1: it consists, for a 95% quantile, in running 100 computations, ordering the
obtained values and taking the one at either the 95-Th or 96-Th position (see the discussion on how to choose k in
Section II.4.4.1). This can be repeated several times and will result in a
distribution of all the obtained quantile values peaking at the theoretical value, with a standard deviation
depending on the number of computations made. As it peaks on the theoretical value, 50% of the estimation are
larger than the theoretical value while the other 50% are smaller.
, independently of the nature of the law, and most of the time,
requesting less estimations than a classical estimation. Going back to the empirical way discussed in Section II.4.4.1: it consists, for a 95% quantile, in running 100 computations, ordering the
obtained values and taking the one at either the 95-Th or 96-Th position (see the discussion on how to choose k in
Section II.4.4.1). This can be repeated several times and will result in a
distribution of all the obtained quantile values peaking at the theoretical value, with a standard deviation
depending on the number of computations made. As it peaks on the theoretical value, 50% of the estimation are
larger than the theoretical value while the other 50% are smaller.
In the following a quantile estimation of 95% will be considered with a requested confidence level of 95% (for more details on this method, see [metho]). If the sample does not exist yet, a possible solution is to estimate the minimum requested number of computations (which leads in our particular case to a sample of 59 events). Otherwise, one can ask Uranie the index of the quantile value for a given sample size, as such:
TDataServer *tds = new TDataServer("useless","foo");
double quant=0.95;
double CL = 0.95;
int SampleSize=200; int theindex=0;
theindex = tds->computeIndexQuantileWilks(quant, CL, SampleSize);
The previous lines are purely informative, and not compulsory: the method implemented in Uranie to deal with the Wilks quantile estimation will start by calling these lines and complains if the minimum numbers of points is not available. In any case, the bigger the sample is, the more accurate the estimated value is. This value is finally determined using the method:
tds->addAttribute( new TNormalDistribution("attribute",0,1));
TSampling * sampis = new TSampling(tds,"lhs", SampleSize);
sampis->generateSample();

double value;
tds->estimateQuantile("attribute",quant, value, CL);
As stated previously, this is illustrated in a use-case macro which results in Figure XIV.5. There one can see results from two classical estimations of the 95% quantile. The distribution of their results is centered around the theoretical value. The bigger the sample is, the closer the average is to the theoretical value and the smaller the standard deviation is. But in any case, there is always 50% of estimation below and 50% above the theoretical value. Looking at the Wilks estimation, one can see that only 5% and 1% of the estimations are below the theoretical value respectively for the 95% and 99% confidence level distributions (at the price of smaller sample). With a larger sample, the standard deviation of the estimated value distribution for a 95% confidence level is getting smaller.
The computation of the correlation matrix can be done either on the values (leading to the Pearson coefficients) or
on the ranks (leading to the Spearmann coefficients). It is performed in the
computeCorrelationMatrix method.
TDataServer * tdsGeyser = new TDataServer("tdsgeyser", "Geyser DataSet");
tdsGeyser->fileDataRead("geyser.dat");
tdsGeyser->addAttribute("y", "sqrt(x2) * x1");

TMatrixD matCorr = tdsGeyser->computeCorrelationMatrix("x2:x1");
cout << "Computing correlation matrix ..." << endl;
matCorr.Print();
Computing correlation matrix ...
2x2 matrix is as follows

|      0    |      1    |
-------------------------------
0 |          1      0.9008
1 |     0.9008           1
Same thing if computing the correlation matrix on ranks:
TMatrixD matCorrRank = tdsGeyser->computeCorrelationMatrix("x2:x1","", "rank");
cout << "Computing correlation matrix on ranks ..." << endl;
matCorrRank.Print();
Computing correlation matrix on ranks ...
2x2 matrix is as follows

|      0    |      1    |
-------------------------------
0 |          1      0.7778
1 |     0.7778           1
As for all methods above, this one has been modified so that it can handle constant-size vectors (at least given the pre-selection of event from the combination of the overall selection and the one provided in the method, as a second argument). As usual, the idea is to consider all elements of a vector independent from the other. If one considers the correlation matrix computed between two attributes, one being a scalar while the other one is a constant-sized vector with 10 elements, the resulting correlation matrix will be a 11 by 11 matrix.
Here are two examples of computeCorrelationMatrix calls, both using the
tdstest.dat file already shown in Section II.3.4, which contains four attributes, three of which can be
used here ( being a non
constant-size vector, using it in this method will bring an exception error). In the following example, two
correlation matrices are computed: the first one providing the correlation of both
being a non
constant-size vector, using it in this method will bring an exception error). In the following example, two
correlation matrices are computed: the first one providing the correlation of both  and attributes while the second focus on the former and only the second element of the
latter.
and attributes while the second focus on the former and only the second element of the
latter.
{
  TDataServer *tdsop =new TDataServer("foo","poet");
  tdsop->fileDataRead("tdstest.dat");

  // Consider a and x attributes (every element of the vector)
  TMatrixD globalOne = tdsop->computeCorrelationMatrix("x:a");
  globalOne.Print();

  // Consider a and x attributes (cherry-picking a single element of the vector)
  TMatrixD focusedOne = tdsop->computeCorrelationMatrix("x[1]:a");
  focusedOne.Print();
}
This should lead to the following console return, where the first correlation matrix contains all pearson
correlation coefficient (considering as a constant-size vector whose element are independent one to another) while the second on focus
only on the second element of this vector (a vector's number start at 0). The following macro is shown in
Section XIV.2.13.
4x4 matrix is as follows

     |      0    |      1    |      2    |      3    |
---------------------------------------------------------
   0 |          1      0.9449      0.6286       0.189
   1 |     0.9449           1      0.8486         0.5
   2 |     0.6286      0.8486           1      0.8825
   3 |      0.189         0.5      0.8825           1


2x2 matrix is as follows

     |      0    |      1    |
-------------------------------
   0 |          1         0.5
   1 |        0.5           1
Warning
When considering correlation matrix, the vectors are handled ONLY FOR PEARSON ESTIMATION. No adaptation has been made for rank ones.
| |  | |
| II.3. Data handling |  | II.5. Visualisation dedicated to uncertainties |